Call or Text: +1 (208) 425-2990
Email: Sales@DroneSprayPro.com

Water-Sensitive Paper Placement for Drone Spray Tests
Place water-sensitive paper at measured positions across the drone’s spray path, and keep card spacing, height, and facing direction the same for every test. When you ditch the crop dusters for drones, change one drone setting at a time and repeat each setting three times - cards from one pass do not count as separate runs.
A sound comparison also needs dry, labeled cards, an unsprayed field blank, and a record of flight settings and weather. Match card placement to the test goal: coverage across the spray path, canopy penetration, or underside deposition.
Compare percent area covered at matching positions using the same analysis settings. Report averages and variation between runs without hiding weak edges in a single overall average. The cards show where spray landed - not whether it controlled pests.
How to use water sensitive paper
sbb-itb-3b7eef7
Place Cards Across the Swath at Crop Height
Water-Sensitive Paper Placement for Drone Spray Tests
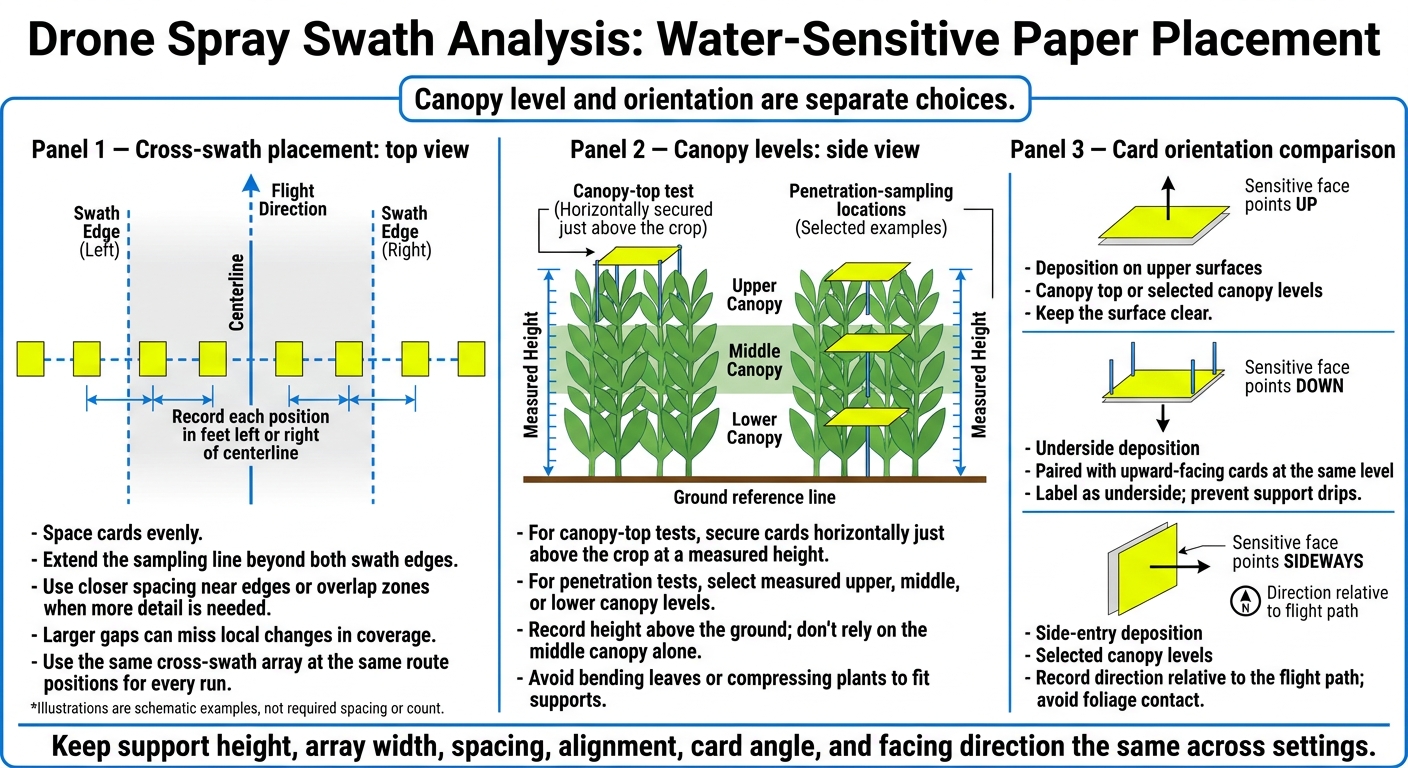
Use cards at canopy height to measure spray deposition on the crop. Keep support height, array width, spacing, and alignment the same across settings.[1]
Space Cards Evenly Across the Flight Path
Set a sampling line perpendicular to the flight path and extend it beyond both swath edges. Space cards evenly, and record each position in feet to the left or right of the centerline. Use closer spacing near edges or overlap zones when you need more detail. Larger gaps can miss local changes in coverage.[2][7]
For canopy-top tests, secure cards horizontally just above the crop at a measured height. Use thin, rigid supports, and place the same cross-swath array at the same route positions for every run.[3][4]
Once the cross-swath array is fixed, keep the canopy level and card facing the same for every run.
Choose Canopy Levels and Card Orientations
For penetration tests, place cards at measured upper, middle, or lower canopy levels. Record their height above the ground, and don’t rely on the middle canopy alone. Avoid bending leaves or compressing plants to fit the supports.
Canopy level and orientation are separate choices. Upward-facing, downward-facing, and vertical cards measure different spray pathways. Choose the orientation that matches the deposition you’re comparing.[3][5][6]
| Card orientation | Measurement purpose | Canopy position | Placement limitations |
|---|---|---|---|
| Upward-facing horizontal | Deposition on upper surfaces | Canopy top or selected canopy levels | Keep the surface clear. |
| Downward-facing horizontal | Underside deposition | Paired with upward-facing cards at the same level | Label as underside; prevent support drips. |
| Vertical | Side-entry deposition | Selected canopy levels | Record direction relative to the flight path; avoid foliage contact. |
Keep each card’s angle and facing direction the same across settings so differences reflect drone settings - not card placement.
Repeat Tests Under Controlled Conditions
Once the card layout is fixed, use the same array for every setting and unused cards for each run. Repeat each setting three times. Cards from a single pass are subsamples - not separate runs.[10] Label every card with its run ID and replicate number. Compare positions within each run separately from differences between runs.
Control Flight Conditions and Track Weather
Use water for baseline coverage tests. If you switch to a formulated product, label those tests separately. Change only the setting you're testing. Keep the sampling layout, card height and orientation, route, travel direction, tank volume, liquid type, swath width, and analysis method constant. Begin far enough before the array to reach steady speed, height, alignment, and spray output. Maintain those conditions until you're beyond the array.[9]
Record the same details for every run so coverage differences reflect the spray setting rather than gaps in the field notes. Measure weather near the array immediately before and after each pass. Log:
- Run ID and setting being tested.
- Speed (mph), height above canopy (ft), flow rate, application rate (gal/acre), and swath width (ft).
- Nozzle or atomizer configuration, liquid type, and starting tank volume.
- Flight direction, wind speed (mph), and wind direction.
- Temperature (°F) and relative humidity (%).
- Date (MM/DD/YYYY) and local start/end times (AM/PM).
- Status - valid, rejected, or interrupted - with the reason and notes.
Keep flight direction relative to the wind consistent. When practical, alternate the setting order to reduce time-related bias. Pause if the wind shifts, an inversion develops, flight becomes unstable, or spray output changes. Document and repeat the affected run. For pesticide tests, follow the product label and applicable FAA, state, and local requirements.[8]
Collect and Store Cards Without Contamination
Protect cards from moisture and handling before analysis. Once aircraft operations have stopped and the area is clear, let the cards dry according to manufacturer guidance. Collect them in position order with clean, dry hands or tools, touching only the edges.
Seal each card separately in a labeled, dry bag linked to the field log. Before analysis, flag cards with fingerprints, drips, damage, foliage contact, or humidity exposure as compromised. Record exclusions rather than silently discarding cards. If needed, repeat the affected sampling with unused cards.
Compare Coverage Across Drone Settings
After collection, compare only cards with the same position, height, and orientation. Matching these conditions makes comparisons between drone settings valid.
Use the Same Card Analysis Method
Use the same paper brand and batch for every run. Scan or photograph all cards with the same lighting, scale, resolution, orientation, and background. Keep cropping, color conversion, detection thresholds, and minimum deposit-size settings fixed. Record the software and settings: resolution below 300 dpi can cause large analysis errors.[14][15] Log excluded card IDs, positions, and reasons alongside the results.
Use percent area covered as the main metric for comparing spray settings. It tracks swath differences better than impact counts when stains overlap. Use impact count per square centimeter only when spray qualities are similar. Merged stains undercount impacts, and overlap becomes hard to interpret above about 20% coverage.[14] Water-sensitive paper measures visible spray impacts - not pest control or, without calibration, exact droplet size.[11][12][13]
Report Average Coverage and Variability by Position
Average matching cards within each run. Then calculate the mean and standard deviation (SD) across those run-level means. Report valid card totals separately from independent run counts. Do not combine edge, intermediate, and center cards before comparing settings.
Report each position separately so a swath average doesn't hide edge effects. Use a separate table for each tested setting, canopy level, and orientation. Here, n is the valid card total, and R is the number of runs contributing valid results.
| Sampling position | Valid cards | Independent runs | Mean percent area covered | SD of run means |
|---|---|---|---|---|
| Left edge | n | R | % | Percentage points |
| Left intermediate | n | R | % | Percentage points |
| Center | n | R | % | Percentage points |
| Right intermediate | n | R | % | Percentage points |
| Right edge | n | R | % | Percentage points |
Check the pattern across positions before combining results. Strong center coverage can hide weak edges, while a large SD signals inconsistent results across runs. Include card dimensions and spacing, crop height, sampling heights, and orientations in the placement map. Attach that map and the run log - including sprayer drone configuration and weather - to each result so comparisons can be repeated.
Conclusion: Keep Card Placement Consistent
Consistent card placement doesn’t improve spray performance. It makes comparisons more reliable. Keep spacing, height, and orientation the same across runs so differences reflect drone settings - not card placement. Count each pass as one run, and use separate runs for replication.
Before each run, check that placement and analysis follow the same setup:
- Dry, labeled, unused cards.
- A marked centerline and measured spacing.
- Matching heights and orientations.
- The same analysis method.
- A complete run log.
FAQs
How do I choose card spacing for my spray swath?
Place water-sensitive paper in a straight row perpendicular to your flight path. Space cards about 10 inches apart for detailed testing or 1–3 feet apart for initial surveys. Put them closer together where deposits change sharply, and extend the row beyond both expected swath edges.
Keep card placement consistent so you can compare results. Set trial pass spacing based on uniform coverage from adjacent passes, typically with 10%–30% overlap - not on the farthest visible stain.
How should I adjust card placement for uneven crop heights?
Place water-sensitive paper cards at a consistent height relative to the crop canopy, not the ground, to measure spray interception accurately. Avoid placing cards at soil level where foliage varies - it won’t reflect canopy coverage.
Use your drone’s terrain-following mode to keep a steady height above the canopy as terrain or crop height changes. Retest the spray pattern in the actual crop to account for how foliage affects airflow and spray interception.
How can I tell whether coverage differences between settings are meaningful?
Place water-sensitive paper 1–3 feet apart across at least twice the expected swath width. Keep every sheet at crop height. Compare the coefficient of variation (CV) for blue-stain density between settings, generally aiming for 25% or lower.
Check adjacent passes for gaps, heavy bands, or streaks. If coverage is inconsistent across at least three repeat passes, fix the variation rather than averaging it out. Coverage shows distribution - not droplet size or efficacy.