Call or Text: +1 (208) 425-2990
Email: Sales@DroneSprayPro.com

Topographic Mapping vs Field Imaging for Crop Planning
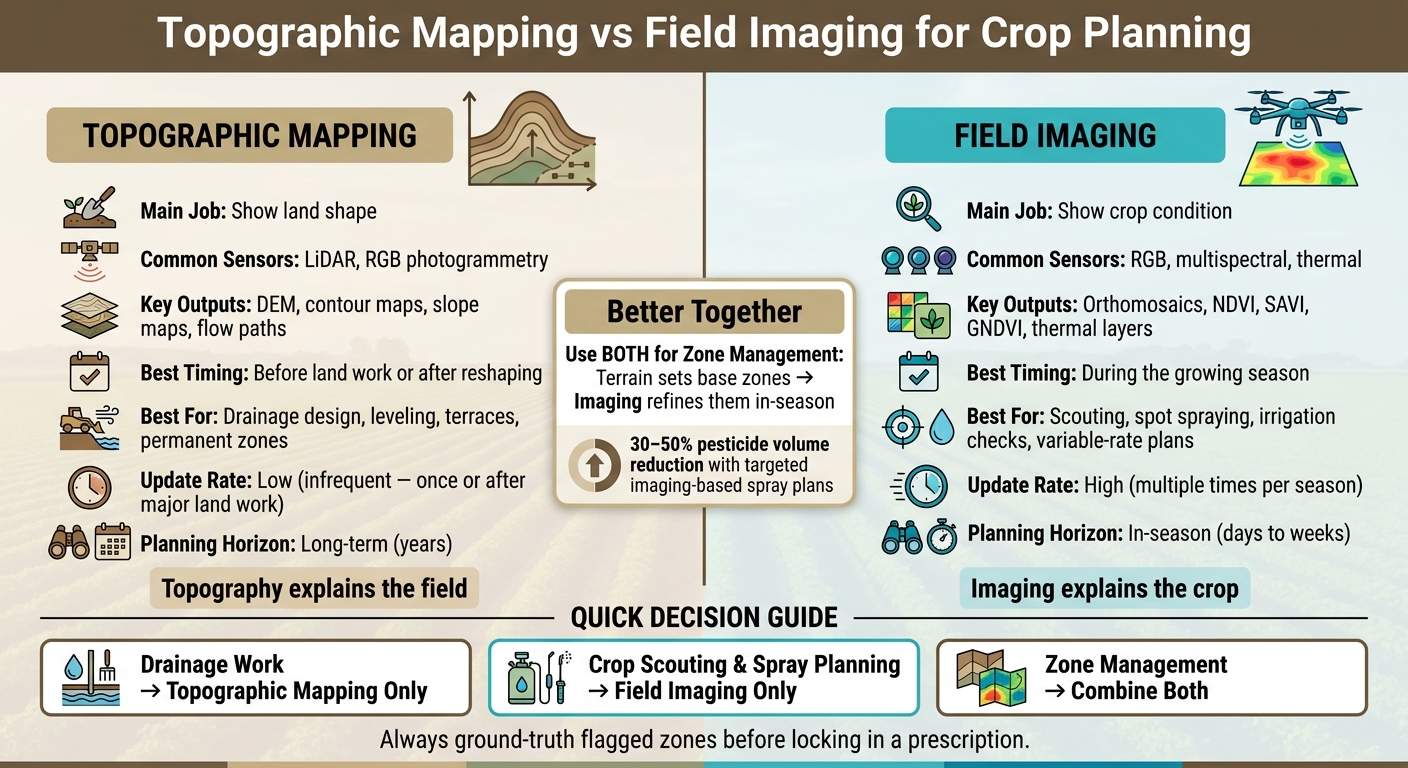
If I need to plan drainage, I use topographic mapping. If I need to find crop stress, weeds, or hot spots in-season, I use field imaging. That’s the whole decision in one line.
Here’s the short version:
- Topographic mapping shows me the shape of the field: elevation, slope, contours, and water flow.
- Field imaging shows me the condition of the crop: vigor, stress, canopy temperature, and weed pressure.
- Topographic data fits long-term work like tile layout, grading, terraces, and base management zones.
- Imaging data fits in-season work like scouting, spot spraying, irrigation checks, and variable-rate plans.
- A topographic map will not tell me which plants are stressed today.
- An NDVI or thermal map will not tell me where water will pool after a hard rain.
- For spray work, imaging can help target problem areas, and some field use cases report 30% to 50% lower pesticide volume than blanket applications.
- Before I act on an image-based prescription, I still need ground checks in the field.
Topographic Mapping vs Field Imaging: Which Tool Fits Your Farm?
Quick Comparison
| Criteria | Topographic Mapping | Field Imaging |
|---|---|---|
| Main job | Show land shape | Show crop condition |
| Common sensors | LiDAR, RGB photogrammetry | RGB, multispectral, thermal |
| Main outputs | DEM, contours, slope, flow paths | Orthomosaics, NDVI, SAVI, GNDVI, thermal layers |
| Best timing | Before land work or after reshaping | During the growing season |
| Best for | Drainage, leveling, long-term zones | Scouting, spray planning, stress checks |
| Update rate | Low | High |
| What it does best | Explain water movement | Flag crop issues now |
| Best use together | Base zones and drainage context | In-season zone updates |
I think of it this way: topography explains the field, imaging explains the crop. When I combine both, I get a clearer view of where problems are happening and what may be causing them.
sbb-itb-3b7eef7
Topographic Mapping: Land Shape, Drainage, and Long-Term Field Design
Topographic mapping gives you the field’s physical starting point for drainage and long-term layout.
Data, Timing, and Outputs
A topographic survey creates a DEM, along with contour, slope, and flow-path layers that show where water moves during rain events [1]. That matters because these layers answer drainage questions crop imagery can’t:
- Where will water collect after a heavy rain?
- Where is erosion risk highest?
- Where should tile drains run?
Do the survey before tile installation, grading, terraces, or waterways. If the land gets reshaped later, that’s when you update it.
Hardware and Software Used for Topographic Surveys
For water management work, centimeter-level accuracy matters. Bad elevation data can put drains in the wrong place or send water where you don’t want it. RTK GNSS, whether used on the ground or through an RTK-enabled drone, gives you the vertical accuracy drainage work calls for [1]. GIS software then turns that elevation model into the contour and flow-path layers agronomists and drainage contractors use.
Drone Spray Pro supplies agricultural spray drones, RTK accessories, training, FAA licensing support, and prebuilt farm packages.
These same layers also set the base zones that field imaging updates later during the season.
How Topographic Maps Support Spray Planning and Zone Management
Elevation data helps you plan and carry out spray work with fewer surprises. Slope maps point out runoff risk, which affects application planning and drift management near waterways. Flow-path layers show wet spots and saturated low areas that can shape flight paths and staging for spray missions [1].
Unlike field imaging, topographic layers change only when the land changes. When you build management zones around elevation and water movement, you get a stable base that in-season imaging can refine. Elevation data also helps plan flight paths and staging before the drone leaves the ground.
That makes topography the permanent layer under any crop-imaging workflow. Field imaging then updates those stable zones with in-season crop data.
Field Imaging: Crop Scouting, Spray Decisions, and In-Season Zones
If topography tells you how a field is shaped, imaging tells you how the crop is reacting on that ground. It follows crop condition through the season, flags stress, helps direct scouting, and supports spot treatment. That’s why it plays such a big role in crop health checks, pest and disease scouting, and weed mapping.
Data, Timing, and Outputs
Field imaging usually gives you RGB maps plus multispectral layers like NDVI. RGB maps make visible crop issues easier to spot. Multispectral imagery goes a step further by picking up crop stress days to weeks before symptoms show up to the human eye [1]. Thermal imagery adds canopy temperature data, which can point to water-stressed zones that may need targeted irrigation attention [1].
Timing matters here. If you want year-over-year comparisons to mean anything, fly at the same growth stage each season. That keeps canopy density and vigor readings on the same footing [1].
Hardware and Software Used for Imaging Flights
Imaging drones can carry RGB, multispectral, or thermal sensors depending on the job [1]. After the flight, processing software turns those images into georeferenced maps or management zones. There’s a catch, though: battery life, weather, and processing time can all slow delivery [1].
So in practice, imaging is usually most useful after flights, not ahead of field design.
How Field Imaging Supports Scouting and Spray Planning
The day-to-day value of field imagery is pretty simple: it helps you avoid walking every acre with no clear target. A grower can review the imagery, find problem zones, and send a scout straight to those areas. For variable-rate prescriptions and zone management, imagery works best when it’s layered with terrain and soil data [1].
It also leads to smarter spray decisions. Multispectral weed mapping can outline spot-treatment areas instead of pushing a blanket application across the whole field [1]. Targeted drone spraying based on imaging can cut total pesticide volume by 30–50% compared to uniform applications [1]. Still, flagged zones need ground-truthing before they’re used in a variable-rate plan [1].
| Application | Payload Type | Documented Impact |
|---|---|---|
| Crop Health Monitoring | Multispectral (NDVI/SAVI) | Early stress detection before visible symptoms [1] |
| Water Stress Detection | Thermal (Canopy Temp) | Targets irrigation to specific stressed zones [1] |
| Weed Mapping | Multispectral | Site-specific herbicide application [1] |
| Spray Application | Tank + Boom | 30–50% pesticide volume reduction [1] |
On problem fields, imagery gets a lot more useful when you pair it with elevation data. Imagery shows the stress pattern. Terrain helps explain why that pattern is happening, especially in drainage trouble spots [1].
Side-by-Side Comparison: Which Method Fits the Job?
Both methods rely on aerial data, but they solve different problems. Topographic mapping shows how the land is shaped. Field imaging shows how the crop is doing right now.
Here’s the simplest way to think about it: one is about field structure, the other is about in-season crop condition.
Purpose, Data Type, and Planning Horizon
| Feature | Topographic Mapping | Field Imaging (Multispectral/Thermal) |
|---|---|---|
| Primary Data | Elevation, slope, 3D terrain models | NDVI, canopy temperature |
| Planning window | Long-term - drainage, leveling, permanent zones | In-season - spraying, irrigation, scouting |
| How often it changes | Infrequent - once, or after major land work | Frequent - multiple times per growing season |
| Best use | Drainage and field layout | Real-time plant health and stress detection |
| Outputs | Contour maps, slope maps, drainage models | NDVI maps, thermal layers, management zones |
Topographic mapping tends to support decisions that stay useful for years. You use it to understand slopes, water flow, and how the field should be laid out. Field imaging works on a much shorter clock. A map that helps with scouting or spraying this week may look different after weather, irrigation, or crop growth shifts conditions.
Use in Spray Planning, Scouting, Drainage Work, and Zone Management
Neither method does every job well. Each has its lane, and in some cases, the best move is to use both.
| Task | Topographic Mapping | Field Imaging | Best Approach |
|---|---|---|---|
| Spray Planning | Identifies slope-driven runoff risk | Flags stress zones for targeted treatment | Imaging drives the decision; terrain checks runoff risk |
| Crop Scouting | - | Directs scouts to flagged problem areas | Imaging only |
| Drainage Work | Essential - slope, flow paths, low spots | - | Topographic mapping only |
| Zone Management | Set base zones from terrain, then refine them with imaging | Updates zones based on in-season crop response | Combine both for best accuracy |
For spray planning, field imaging usually leads because it points to where stress is showing up now. Topographic mapping still matters, though, because slope can hint at runoff risk. That extra check can keep a spray plan from looking good on paper but causing trouble in the field.
For drainage work, the choice is simple. You need slope, flow paths, and low spots, so topographic mapping is the tool that fits. For scouting, it flips the other way. Imaging helps crews stop wandering and head straight to the areas that need a closer look.
Zone management is where things get more interesting. Terrain can help set base zones, then imaging can fine-tune those zones based on how the crop responds during the season. One gives you the layout. The other shows how that layout is playing out in real time.
When to Use One Method or Combine Both
Use topographic mapping for drainage design, leveling projects, and permanent field zones. Use field imaging for spray decisions, scouting direction, and mid-season variable-rate prescriptions. If imaging flags a problem zone, confirm it with field scouting before locking in a prescription.
When both are used together, the picture gets clearer. Terrain helps explain why some stress patterns keep showing up in the same places, while imaging shows where the current problem zones are.
The practical rule is pretty simple: use topography for field structure and imaging for in-season crop decisions.
Conclusion: Build a Smarter Crop Planning Workflow
Topographic mapping shows how a field is laid out. Field imaging shows what the crop looks like right now. Each tool has its own job, and that’s what keeps the workflow efficient: structure first, crop status second.
Key Takeaways for U.S. Growers
For day-to-day field use, the rule is simple. Use topography to build permanent field structure. Use field imaging to guide in-season crop and spray decisions. When you use both together, zone accuracy gets better.
Before you lock in a full-field prescription, scout the flagged zones in person.
To move from mapping to application, Drone Spray Pro supports growers with agricultural spray drones, RTK equipment, training, FAA licensing support, and prebuilt farm packages.
FAQs
Which tool should I start with?
If you're just getting started with drones, or you mainly need simple field checks, an RGB sensor is the best place to begin. It costs less, it's easy to work with, and it gives you instant visual feedback on crop conditions and surface soil moisture.
For deeper, data-led farm decisions, go with multispectral sensors. If your main focus is spotting early water stress or irrigation issues, pick a thermal sensor. Many growers and consultants end up using a mix of sensors to build more precise zone-based treatment maps.
Can I use topographic mapping and field imaging together?
Yes. Using them together can improve precision agriculture.
Topographic mapping gives you a 3D model of the terrain, which lets a spray drone hold a more consistent height as it follows the ground. Field imaging, such as multispectral or thermal data, shows where crops are healthy and where stress is starting to show.
When you combine both into one prescription map, the drone can make terrain-aware, targeted applications. That means less waste and better crop performance.
How often should I update each type of data?
Update data based on your goals and the type of imagery you're using.
For crop health and field variability, fly at key growth stages. A common window for corn is V4 to V6. That helps keep your data lined up from season to season, so you're not comparing apples to oranges.
If you're using multispectral or thermal imagery for stress or disease tracking, repeat flights on a set cadence. One flight gives you a snapshot. Repeat flights show change over time, which is usually what matters in the field.
For spray planning, schedule a follow-up flight about 10 days after application. If you're working with satellite data too, line up drone flights with satellite overpass dates. And if you spot trouble areas, ground-truth those hotspots within 24 to 48 hours.
