Call or Text: +1 (208) 425-2990
Email: Sales@DroneSprayPro.com

Thermal Anomaly Models: Crop Disease Detection
Thermal maps can show crop stress before leaf spots show up - but a hot area is not proof of disease. I’d use thermal data for one job first: find suspect zones fast, check them in the field within 24–48 hours, and only spray where disease is confirmed.
Here’s the short version:
- What thermal models do: flag canopy areas that run hotter than nearby plants because stressed plants cool less through transpiration
- What they don’t do: tell me, by themselves, whether the cause is disease, drought, compaction, bare soil, or nutrient issues
- Best flight window: about 10:00 a.m. to 2:00 p.m.
- Useful sensitivity: some thermal cameras can detect about 0.2°F differences
- Key preprocessing step: mask bare soil first so hot ground doesn’t distort canopy readings
- Common stress metric: CWSI, where values above 0.36 can point to major stress
- Best practice for confidence: compare 3+ flights spaced 5–7 days apart
- Before spraying: pair thermal with NDVI/NDRE, NDWI, and RGB, then ground-check the exact GPS points
- For spray planning: use RTK so scouting points and spray rows line up
If I had to boil the full article down to one rule, it would be this: <u>thermal maps guide scouting; they do not diagnose disease alone.</u>
A fast way to think about it:
| Step | What I’d do | Why it matters |
|---|---|---|
| 1 | Fly under steady conditions | Reduces noise in the map |
| 2 | Build and clean the thermal map | Separates canopy heat from soil heat |
| 3 | Check hotspots on the ground | Cuts false positives |
| 4 | Spray only confirmed zones | Lowers waste and missed calls |
The rest of the article explains that map-scout-spray process in plain terms, with the main limits, model options, and field checks that matter most.
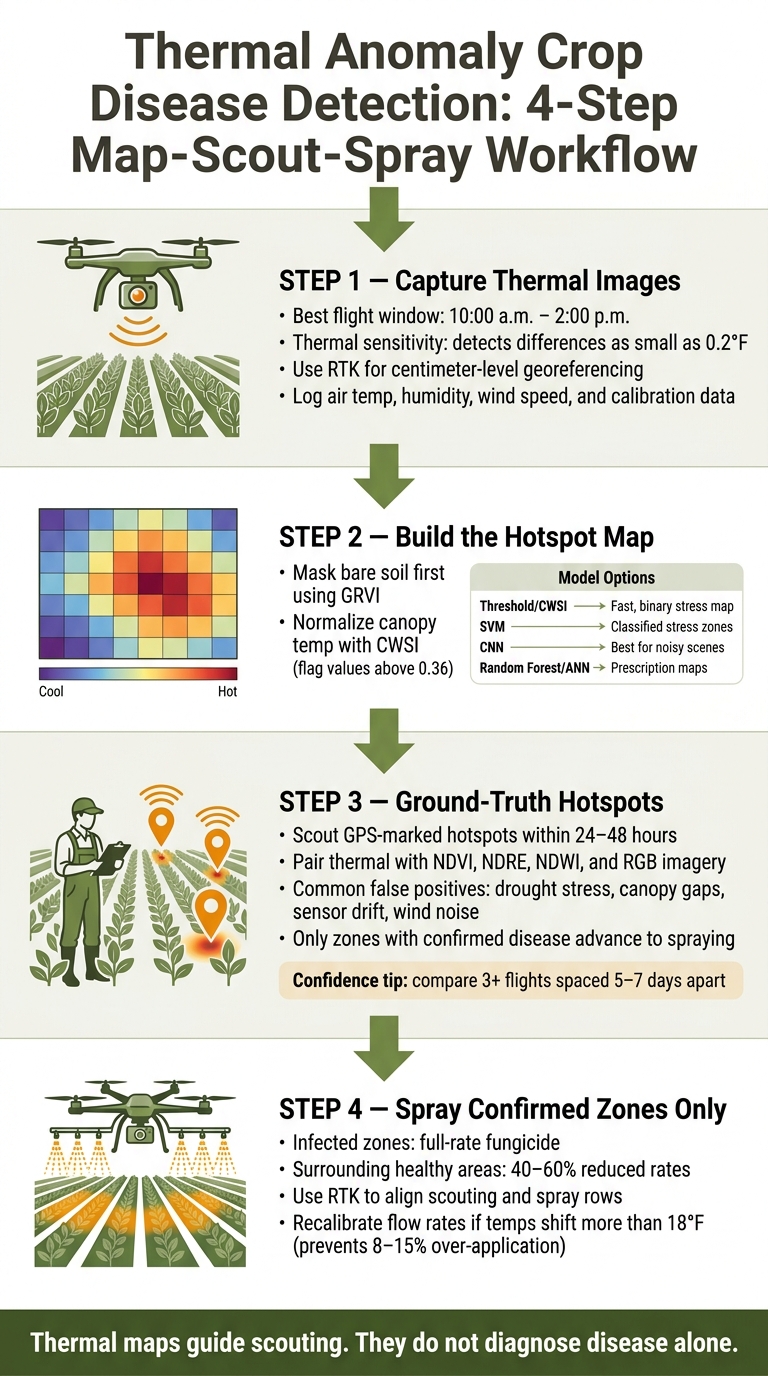
Thermal Anomaly Crop Disease Detection: 4-Step Map-Scout-Spray Workflow
AI is Changing Disease Detection in Farming: Drone Imagery + Remote Sensing (2026)
Step 1: Capture Usable Thermal Image Inputs with Agricultural Drones
A thermal anomaly model is only as good as the drone images behind it. If flight conditions shift, calibration is weak, or georeferencing drifts, actual crop stress can get buried in noise. For disease detection, the target isn't just warm pixels. It's reliable hotspots that line up with actual plant stress. Those capture decisions shape whether the model picks up disease or just field clutter.
Set Flight Timing, Overlap, and Field Conditions to Reduce Noise
The best window for thermal mapping is mid-morning to early afternoon, roughly 10 a.m. to 2 p.m.[2] That time frame helps you catch peak heat stress under steady solar radiation. Keep altitude and speed consistent, and use high front and side overlap so you can build clean thermal orthomosaics and compare them from one mission to the next.
You should also log air temperature, humidity, wind speed, and radiometric calibration data so thermal readings stay comparable across flights.[3] That step matters more than it may seem. High-quality thermal cameras can detect temperature differences as small as 0.2°F,[3] which is sensitive enough to spot subtle disease-linked stress before visible symptoms show up.
Use RTK-Enabled Drone Setups for Repeat Flights and Follow-Up Spraying
Thermal scouting often runs in a simple map-scout-spray loop. In plain terms, the workflow looks like this:
- Map hotspots
- Scout the field
- Spray confirmed disease zones
RTK-enabled setups help keep that loop tight by giving you centimeter-level georeferencing. That way, each flight lines up with the last one, and hotspot locations stay consistent across missions. Drone Spray Pro offers RTK accessories and pre-built agricultural drone packages for repeat mapping and follow-up spraying.
Next, those images feed the anomaly model to produce hotspot maps.
Step 2: Run the Thermal Anomaly Model from Images to Hotspot Maps
Now that the flights from Step 1 are calibrated, the next job is to turn those thermal frames into a georeferenced canopy map.
After image capture, process the data into a hotspot map. Raw thermal imagery can't guide scouting or spraying on its own. It needs calibration, normalization, and segmentation first. The aim is simple: separate disease-linked heat from normal field variation.
Preprocess Images and Normalize Canopy Temperature Data
Start by stitching the frames into a georeferenced orthomosaic. Then move into preprocessing, which includes radiometric calibration, environmental adjustment, and noise reduction.
One thing matters early: mask bare soil first. Soil heats up fast, and that can throw off canopy temperature readings. Use GRVI to split canopy from bare ground [3].
Next, normalize canopy temperature with CWSI. Values above 0.36 point to major stress [3]. Once the canopy temperatures are normalized, you can use that layer to flag likely disease hotspots.
Detect Anomalies with Thresholds or Machine Learning
With normalized canopy data ready, operators can detect anomalies with threshold-based methods or machine learning.
Threshold-based methods are fast and easy to run. The tradeoff is that they can mislabel drought stress or soil interference as disease. That makes them useful for quick screening, but not always enough on their own.
Machine learning adds more nuance. It can sort thermal hotspots into different stress zones, such as disease, drought, soil, or nutrient stress. CNNs help most in noisy scenes because they pick up spatial patterns across more than one data layer. The catch? They need good training data and more compute.
Here’s a side-by-side look at the main model options [3]:
| Model Type | Required Inputs | Primary Output | Practical Tradeoffs |
|---|---|---|---|
| Threshold-Based (CWSI) | Thermal + Ambient Temp | Binary stress map | Fast; false positives from drought or soil [3] |
| Support Vector Machine (SVM) | Thermal + RGB features | Classified stress zones | Accurate; needs training data [3] |
| CNN (Deep Learning) | Thermal + Multispectral | Severity/risk polygons | Best for noisy scenes; high compute [3] |
| Random Forest / ANN | Thermal + NDVI + IoT data | Prescription maps | Accurate with multimodal inputs; complex to integrate [3] |
These outputs become the hotspot layers that scouts and spray teams use in the field.
Create Output Layers for Scouts and Spray Teams
Export hotspot maps as shapefiles or prescription layers for scouting routes and variable-rate spray plans [1]. Since the layers are georeferenced, spray teams can load them straight into mission-planning software.
Running flights on a weekly or bi-weekly schedule makes time-series checks much easier. You can compare hotspot maps across dates and see whether stress is spreading or whether treatment is working [1].
Those confirmed hotspot layers then move into the scouting and spray-planning steps that come next.
sbb-itb-3b7eef7
Step 3: Check Field Limits Before Acting on Thermal Hotspots
After Step 2 flags hotspots, Step 3 is where you separate actual disease signals from plain field noise. A hotspot on a thermal map doesn't automatically mean disease. It can also point to irrigation issues, canopy gaps, or sensor-related error. So before you build any spray plan, you need to confirm what each hotspot means in the field.
The job here is simple: verify first, spray later.
Common Causes of False Positives in Thermal Disease Detection
Thermal models can confuse disease stress with other forms of plant stress. Canopy temperature changes don't come from one cause only. Disease can heat plants up, but so can non-disease stress.
A common look-alike is water deficit. When plants are short on water, they close their stomata and their canopy temperature goes up. Canopy gaps can also show up as hotspots. On top of that, sensor drift, wind, turbulence, and shifting light can all add noise to the map [4].
That matters early, because a thermal hotspot may reflect disease or something else entirely. Even localized hotspots still need field checks before treatment.
Use Ground Truth to Confirm Disease Before Treatment
Thermal maps show you where to look, not what to spray.
Send scouts to GPS-marked hotspots within 24–48 hours. In each zone, inspect stems, lower leaves, and pods for visible disease signs. At the same time, check soil moisture and irrigation uniformity. If thermal stress and NDVI both drop in the same area, move that zone up the scouting list.
When a visual check doesn't explain the hotspot, collect samples. Only zones with confirmed disease should move into spray planning.
When to Pair Thermal Data with RGB or Multispectral Imagery
A thermal-only workflow is useful for fast screening. But if you need better separation between disease stress and water deficit, a second image layer helps a lot.
Use thermal plus NDVI to sort likely disease from likely water stress. High-resolution RGB gives you one more check. It can show whether a hotspot is actually a canopy gap or a bare-soil patch [4].
| Thermal Limitation | Look-alike | Action |
|---|---|---|
| Abiotic Confusion | Drought or uneven irrigation | Pair thermal with NDVI and NDWI |
| Background Noise | Bare soil or canopy gaps | Mask non-vegetation pixels in preprocessing |
| Sensor Drift | Inconsistent calibration or sensor aging | Use pre-flight calibration targets and irradiance systems |
| Environmental Noise | Wind, turbulence, or shifting light | Use gimbal-stabilized sensors; fly in stable weather |
| Low Spatial Resolution | Small disease clusters blurred into healthy canopy | Fly lower or overlay high-res RGB for detail |
A practical flow looks like this:
- Use thermal first to flag suspect zones.
- Use multispectral data to test for water stress or chlorophyll loss.
- Use RGB to see whether the hotspot is bare soil or a canopy gap.
Once a hotspot holds up across those checks, it becomes a scouting target and a spray-zone candidate.
Step 4: Turn Thermal Anomaly Results into Scouting Routes and Spray Plans
With confirmed GPS points from Step 3, the next move is simple: turn those hotspots into a scouting route and a spray plan. This is where diagnosis turns into field action.
Rank Scouting Zones by Hotspot Severity and Field Pattern
Start by ranking zones based on three signals:
- Canopy-temperature deviation
- Low NDVI or NDRE
- Repeat appearance across multiple flights
That last one matters a lot. A hotspot that shows up once could be noise. A hotspot that keeps showing up is a different story. Identification gets better with three or more flights spaced 5–7 days apart, which helps separate growing hotspots from static anomalies [5].
Use the confirmed hotspot list from scouting to plan the next pass. Put extra focus on edge rows, low spots, and irrigation transitions, then cross-check those areas against soil-zone and outbreak history.
Convert Confirmed Hotspots into Targeted Spray Zones
Once scouts confirm disease, turn that hotspot into a treatment layer for the spray drone. The idea is straightforward: treat only the flagged rows and leave healthy sections out of the plan.
In practice, infected zones get full-rate fungicide, while surrounding healthy areas get 40–60% reduced rates [5]. Use RTK to line up scouting and spray missions on the same rows and cut overlap.
Watch temperature swings between scouting and spraying. If temperatures shift by more than 18°F, recalibrate flow rates. At that point, changes in liquid viscosity can lead to 8–15% over-application [5].
Conclusion: Use Thermal Maps to Guide Scouting and Treatment, Not as a Stand-Alone Diagnosis
Use thermal maps to point scouts in the right direction first. Then treat only the zones where disease is confirmed. Put another way: scout first, spray only confirmed zones.
FAQs
How early can thermal maps catch crop disease?
Thermal maps can spot crop disease at the pre-visual stage. In plain English, they can pick up small hot spots before you can see lesions, wilting, or yellowing with the naked eye.
By tracking canopy temperature, they help teams catch plant stress early and scout those areas sooner. That said, thermal data works best when you check it against RGB or multispectral imagery. That extra layer helps confirm whether the heat pattern comes from disease, water stress, or something else in the field.
What can cause a false hotspot on a thermal map?
False hotspots don't always point to crop stress. Sometimes, the cause is the field itself or the weather.
Common triggers include high winds, high humidity, and cloud cover. These conditions can change canopy temperature or interfere with sensor readings, which may lead to misleading hotspot patterns.
Hotspots can also point to issues that have nothing to do with disease, such as:
- localized water stress
- soil compaction
- nutrient deficiencies
That's why thermal data should always be checked against physical scouting in the field.
How do scouts turn hotspots into spray zones?
Scouts use thermal hotspots as a starting point, then turn them into spray zones by checking what’s behind the stress. Thermal sensors point out canopy temperature anomalies, and pixel-aligned RGB imagery helps confirm visible signs such as lesions or discoloration.
Once the team has ground-truthed those areas, the validated data is converted into georeferenced prescription maps. Those maps direct variable-rate spraying, so fungicides go only to spots where infection is confirmed instead of being sprayed across the entire field.
