

Call or Text: +1 (208) 425-2990
Email: Sales@DroneSprayPro.com

Sample Depth Shapes Drone Soil Moisture Map Accuracy
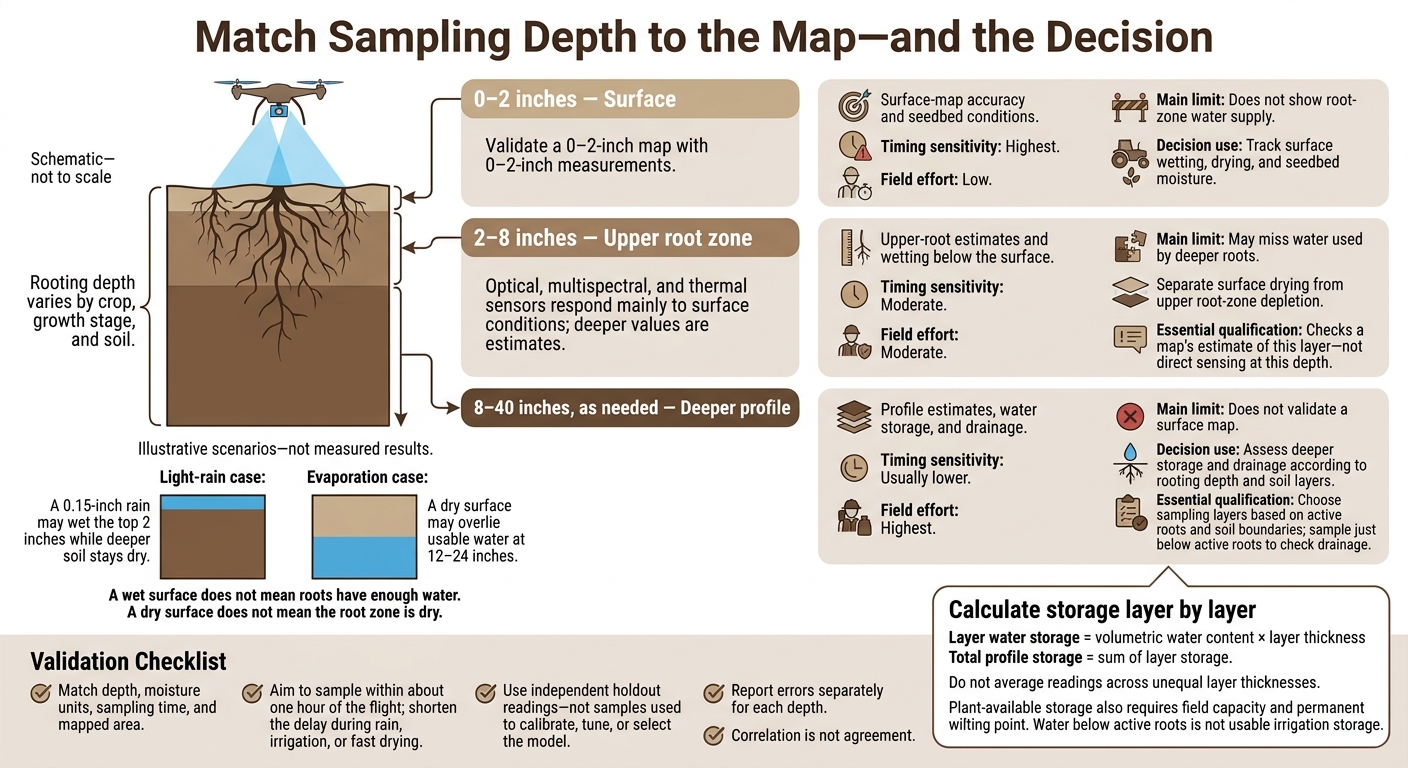
Check a drone soil moisture map against samples from the depth it claims to measure. A reading taken 24 inches deep cannot validate a 0–2-inch surface map. For irrigation, check the active root zone too: a wet surface does not mean roots have enough water.
The three sampling ranges answer different questions:
- 0–2 inches: Tracks surface wetting, drying, and seedbed moisture.
- 2–8 inches: Checks upper-root moisture and maps that estimate this layer - not direct sensing at that depth.
- 8–40 inches, as needed: Checks deeper water storage and drainage, based on rooting depth and soil layers.
Quick Comparison
| Sampling depth | What it can check | Timing sensitivity | Field effort | Main limit |
|---|---|---|---|---|
| 0–2 inches | Surface-map accuracy and seedbed conditions | Highest | Low | Does not show root-zone water supply |
| 2–8 inches | Upper-root estimates and wetting below the surface | Moderate | Moderate | May miss water used by deeper roots |
| 8–40 inches | Profile estimates, water storage, and drainage | Usually lower | Highest | Does not validate a surface map |
For a fair accuracy check, match depth, moisture units, sampling time, and mapped area. Aim to sample within about one hour of the flight, with less delay during rain, irrigation, or fast drying. Report errors separately for each depth using readings kept out of model calibration.
For irrigation decisions, combine layer-by-layer readings with rooting depth and soil-water limits. Calculate storage using each layer’s thickness rather than averaging unequal layers.
Drone Soil Moisture Maps: Match Sampling Depth to the Decision
Precision Soil Moisture Monitoring with L-band Drone Mapping
sbb-itb-3b7eef7
1. Shallow Sampling: 0–2 Inches
Judge a 0–2-inch map only against measurements from that same surface layer.
Surface-layer alignment
A 0–2-inch sample fits drone products validated for near-surface soil, especially over bare ground. Canopy, residue, roughness, shadows, and calibration can change the effective sensing depth and accuracy.[8][11]
Validation reliability
Once depths match, consistent field sampling becomes the main accuracy check. Keep every core within the 0–2-inch interval, then compare it with the matching map pixel or neighborhood average.
Record GPS position, sampling time, recent rainfall or irrigation, soil texture, and canopy or residue cover. For probe checks, NASA’s validation protocol recommends four replicate readings per point, covering different row positions where applicable.[7][9]
Ground samples and map output must also use the same moisture unit. Gravimetric water content, volumetric water content, and moisture index are not interchangeable.[7][9]
Decision use
Shallow data work mainly as a seedbed indicator. USDA guidance identifies 0–3 inches as an appropriate measurement depth for assessing seeding success.[10] Use the map to flag dry seedbeds or crusting - not to estimate root-zone storage.
2. Intermediate Sampling: 2–8 Inches
Use 2–8-inch sampling when moisture in the top 0–2 inches no longer reflects conditions in the upper root zone.
Sensor-depth alignment
A 2–8-inch sample checks the map’s upper root-zone estimate. It does not confirm direct sensing at that depth: optical, multispectral, and thermal sensors respond mainly to surface conditions.
Validation reliability
Sample at fixed intervals, such as 2–4 and 6–8 inches, and compare each interval separately across flights. Keep the time between irrigation or rain and each flight consistent.
Report bias and RMSE for moisture estimates. For relative maps, use rank correlation or class agreement.
Agricultural decision value
After irrigation, shallow soil may be wet before water reaches 6–8 inches. Later, evaporation can dry the surface while the deeper layer stays moist.
Before irrigating, use these readings to separate surface drying from upper root-zone depletion.[12][13] If surface and intermediate readings differ, deeper sampling shows whether water remains below the upper root zone.
3. Deeper Sampling: 8–40 Inches as Needed
When surface and upper-root readings leave questions, sample deeper layers to explain differences within the root zone. These samples show where water is stored and how it moves - not how deep a drone can sense.
Sensor-depth alignment
Treat 8–40-inch measurements as root-zone context, not drone output. Choose sampling layers based on active roots and soil boundaries. Compaction, hardpans, and other restrictive layers can limit useful sampling depth. Sample each distinct layer within the root zone.[1][4][5]
Validation reliability
Use soil cores or calibrated multi-depth probes. Record layer thickness, moisture units, location, and flight time. If the map estimates profile storage, compare that estimate with total profile storage, not a single deep reading.
Agricultural decision value
Deep sampling answers a different question from map validation: how much water remains available in the soil profile?
Calculate storage for each layer by multiplying volumetric water content by layer thickness, then add the results. Do not average readings across unequal layer thicknesses.
Measure just below the active root zone to check drainage. Repeat readings after irrigation or rainfall to see whether water reached the intended layers or moved below active roots. Water below the roots’ reach does not count as usable irrigation storage.
Comparing Validation Reliability by Depth
Compare map accuracy by matching depth, timing, and footprint. Deeper readings test conditions below the surface - not the accuracy of a surface map.
The table shows what measurements at each depth can and cannot verify.
| Sampling depth | Timing sensitivity | Footprint and depth match | Field effort | Main accuracy risks |
|---|---|---|---|---|
| 0–2 inches | Highest; surface conditions can change quickly after irrigation, rainfall, or drying | Best match for a surface-moisture map; keep measurement volume consistent | Low, though patchy conditions may require more sampling points | Crusting, residue, canopy effects, evaporation, roughness, and probe-placement error |
| 2–8 inches | Moderate; changes more slowly than the surface but can still shift after infiltration or drainage | Valid only when the map targets this layer | Moderate; requires layer-specific sampling and repeated measurements | Mixed intervals, uneven insertion depth, texture effects, and confusion about depth averages |
| 8–40 inches | Lower short-term sensitivity, though recent wetting and drainage still matter | Tests subsurface predictions, not surface-map accuracy | Highest; augering or multi-depth probes add labor and disturb the soil | Sparse samples, strong variation between depths, bulk-density error, delayed wetting, and reading too much into correlation |
Match Sampling Time, Depth, and Map Area
Sample within about an hour of the flight, with a shorter window during irrigation, rainfall, or rapid drying. Record probe insertion depth and sampling volume. Use consistent sampling intervals and repeat readings. Match each reading to the correct pixel or buffer - a single probe rarely represents the entire mapped area.[7][9]
Sample Across Moisture Levels and Record Conditions
Sample wet, moderate, and dry zones using field knowledge, soil maps, irrigation layout, or random points - not map colors alone. Keep soil layers separate. A depth-weighted 0–8-inch average provides a check, but it cannot replace separate measurements for each layer. Record probe calibration and any bulk density used to convert gravimetric measurements to volumetric water content.[19][20]
Keeping layers separate also lets the next section compare how each depth supports irrigation decisions.
Report Independent Accuracy for Each Depth
Report accuracy separately for each depth rather than combining results into one score. Test against holdout readings that were not used to calibrate, tune, or select the model. For each depth, report sample count, mean observed and predicted moisture, bias, MAE, and RMSE. Use consistent volumetric units, such as in³/in³, and match measurements to the map’s intended layer.[15][16]
Correlation is not agreement: a map can correctly rank wet and dry areas while consistently reporting moisture levels that are too high. Report errors alongside correlation so bias does not get hidden. Better results at depth may come from shared soil patterns, weather or vegetation inputs, or averaging - not deeper sensor penetration.[17][18]
Comparing Sampling Depths for Irrigation Decisions
Compare readings from matching depths to judge whether root-zone water supplies meet irrigation needs.
| Sampling approach | Best-supported decisions | Advantages | Limitations | When other depths are needed |
|---|---|---|---|---|
| 0–2 inches | Detect recent rain, irrigation, evaporation, and surface wetting | Responds fast to weather and irrigation | Does not measure root-zone storage; strongly affected by evaporation and residue | Add intermediate or deep readings for irrigation decisions |
| 2–8 inches | Assess upper-root moisture and early establishment | Tracks wetting below the surface | May not represent deeper roots or total irrigation storage; response can lag behind surface wetting | Add deeper intervals when roots extend below 8 inches or surface and root-zone conditions differ |
| 8–12 and 12–24 inches | Assess root-zone storage, depletion, infiltration, and drainage; estimate plant-available water and irrigation need | Shows how upper and lower layers differ; helps guide irrigation timing and infiltration checks | Requires layer thickness, soil-water retention data, calibration, representative locations, and repeated measurements | Extend toward 30–40 inches or beyond when active rooting depth or specific drainage and storage questions call for it |
Shallow Readings Track Surface Wetting
Shallow readings show surface wetting - not total water available to roots. Evaporation can dry this layer even when water remains below. Residue, canopy cover, soil texture, and surface roughness also affect how useful these readings are for irrigation decisions.[14][24]
Intermediate Readings Assess Upper-Root Moisture
Match sampling depths to where roots actually grow. Seedlings may rely heavily on the upper 2–4 inches, while mature crops may draw water from much deeper layers. A dry reading after irrigation may simply mean the wetting front hasn't reached that depth yet.[14][22]
Deeper Readings Assess Water Storage and Drainage
Sample deeper only when rooting depth or drainage questions call for it. To estimate plant-available storage, use each layer’s thickness, field capacity, and permanent wilting point. Multiply its plant-available volumetric water content by its thickness, then add the layer totals - do not average unequal layers.[21][23][24]
Pair Depths When Surface and Root-Zone Moisture Differ
Light-rain case: A 0.15-inch rain may wet the top 2 inches while deeper soil stays dry. Evaporation case: A dry surface may overlie usable water at 12–24 inches.[14][22][24]
Use shallow readings to track surface wetting and deeper readings to assess root-zone supply.
Conclusion: Match Depth to the Map and Decision
Validate the depth the map claims to measure. Use shallow samples for surface maps and deeper samples only for root-zone context or irrigation decisions. Surface moisture changes faster than root-zone water. Matching depths helps prevent false claims of map error and keeps map validation separate from irrigation use.[6]
Report the sensor type, moisture metric, represented depth, sampling time, recent rain or irrigation, sampling intervals, soil texture, crop stage, rooting depth, and units.
Report each depth separately. Don’t combine shallow and deep readings into one score. Strong agreement at the surface supports only a surface-moisture claim.[6]
FAQs
How can I verify which depth my drone map represents?
Check the multispectral sensor data and index formulas used in processing against known soil moisture baselines. Multispectral sensors mainly measure surface moisture, while thermal imagery can offer clues about irrigation problems below the surface.
Limited soil penetration and vegetation can affect sensor readings, so check the map in the field. Compare mapped stress zones with soil moisture measurements and root conditions at different depths to see which readings align with the imagery.
How do I interpret conflicting surface and root-zone readings?
Treat drone RGB and multispectral estimates as surface or shallow-layer readings, not measurements of the full root zone. Thermal data can show moisture patterns, but surface conditions and irrigation timing may influence those patterns.
During field scouting, check representative high, transition, and low zones, and confirm the map’s georeferencing. If surface moisture-stress indicators don’t match plant or soil behavior, sample deeper in the root zone to help diagnose irrigation, drainage, or subsurface issues. [1][2][3]
How do I choose deeper sampling depths for my crop?
Standard drone sensor outputs work best for surface and shallow soil analysis. Accuracy drops with depth. For deeper root-zone readings, pair drone maps with field scouting: check soil moisture and compaction in flagged areas.
Deeper measurements are especially useful when crop stress keeps returning or irrigation isn't performing as expected. Read those measurements alongside drone maps and soil, drainage, and irrigation records.