Call or Text: +1 (208) 425-2990
Email: Sales@DroneSprayPro.com

How to Use Drone Data for Yield Optimization
Drones are transforming farming by providing precise, real-time data that helps farmers make better decisions. From improving crop health to reducing input costs, drones offer practical solutions for challenges like rising costs and unpredictable weather. Studies show drones can increase yields by up to 20% and save up to $40 per acre by optimizing inputs like nitrogen and water.
Here’s what you’ll learn:
- Choosing the right drone and sensors: RGB for terrain, multispectral for crop health, thermal for water issues, and LiDAR for elevation.
- Planning flights: Use tools like DroneDeploy or Pix4D for accurate mapping. Fly at optimal times to reduce glare and ensure data quality.
- Processing data: Create NDVI maps to assess plant health and orthomosaic maps to analyze field conditions.
- Integrating data: Combine drone imagery with historical yield, soil, and climate data for better predictions.
- Applying insights: Divide fields into zones and use drones for precise spraying to cut costs and boost productivity.
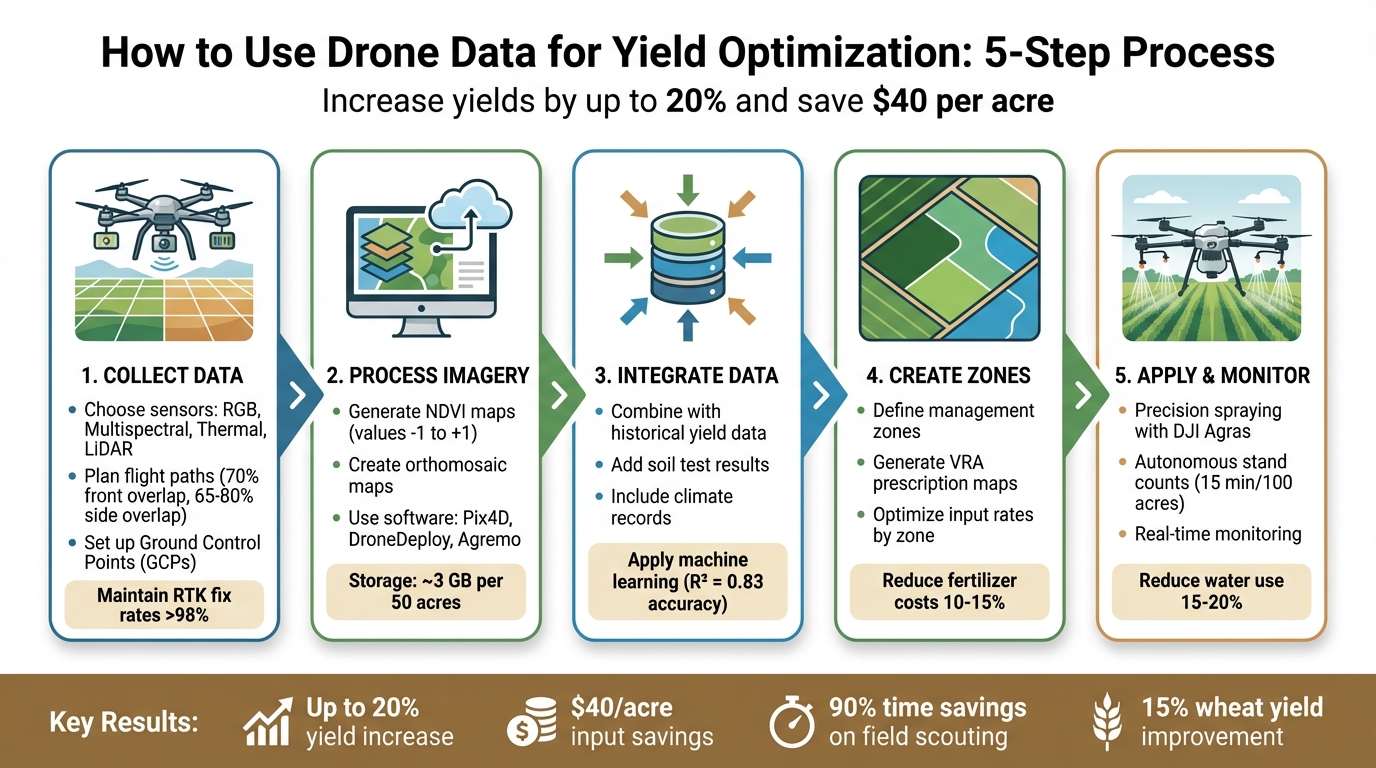
5-Step Drone Data Workflow for Yield Optimization in Agriculture
Mapping Drones in Agriculture
sbb-itb-3b7eef7
Collecting High-Quality Drone Data
The success of your yield optimization efforts hinges on the quality of the data you gather. Poor planning or using the wrong equipment can result in distorted maps, missed problem areas, and wasted time. To avoid these pitfalls, start with the right tools, plan flights carefully, and anchor your data to precise, real-world coordinates.
Choosing the Right Drone and Equipment
The type of sensor you use dictates what you can measure and directly affects the insights you gain. For example:
- RGB cameras: Ideal for creating 3D terrain models and general field documentation.
- Multispectral sensors: Essential for NDVI analysis, which uncovers hidden crop stress.
- Thermal cameras: Detect heat anomalies like irrigation leaks or drought stress.
- LiDAR: Penetrates dense canopies to provide detailed elevation data.
If you’re mapping fields, you’ll need centimeter-level precision. Systems like RTK (Real-Time Kinematic) and PPK (Post-Processed Kinematic) can achieve this even in challenging conditions. Between January and July 2024, researchers tested six DJI Agras T50 drones in extreme climates - from –8°F in North Dakota to 126°F in Arizona. These drones maintained RTK fix rates above 98%, with the T50’s white shell reflecting 34% more solar radiation and improving GPS stability by 23% in intense heat [3].
For year-round durability, choose drones with high IP ratings (e.g., IPX6K) to guard against moisture and dust, especially during rapid temperature changes. Also, ensure your drone is compatible with flight planning software like DroneDeploy, Pix4D, or DJI Pilot 2. These tools allow you to set image overlap, altitude, and automated flight paths. At Drone Spray Pro, we provide DJI Agras drones and accessories like RTK dongles, batteries, and chargers tailored for agricultural needs.
Once you’ve selected the right drone and sensors, focus on precise flight planning to capture the best data.
Planning Flight Paths for Data Accuracy
Careful flight planning ensures you collect professional-grade data that supports better crop management decisions. Start by selecting the right mission type - polygon missions are great for irregularly shaped fields and can save time compared to standard grid patterns. Your flight altitude determines image resolution; lower altitudes capture more detail but require more images and longer flight times. Aim for about 70% overlap at the front and 65–80% on the sides for successful image stitching. Add a 15–20% buffer zone beyond your field boundaries to avoid edge distortion.
For narrow areas like irrigation ditches, divide the flight into overlapping sections instead of a single path to maintain consistent side overlap. Begin near your takeoff point and minimize turns to conserve battery life. Timing also matters: fly RGB sensors early in the morning or late afternoon to reduce glare, and use multispectral sensors under overcast skies for consistent reflectance. As Chad Colby of Colby Agtech explains, "10 am–2 pm is going to give you the best light" for general mapping [4]. Avoid flying in winds above 10 mph, as they can destabilize maps. Use apps like UAV Forecast or Windy to check weather conditions before launching.
| Sensor Type | Best Time to Fly | Primary Agricultural Use |
|---|---|---|
| RGB (Visual) | Early morning / Late afternoon | 3D terrain modeling and visual documentation |
| Multispectral | Mid-morning / Light overcast | NDVI analysis and crop health assessment |
| Thermal | Dawn or dusk | Detecting irrigation leaks and heat stress |
| LiDAR | Midday (clear conditions) | High-accuracy elevation mapping and canopy penetration |
Setting Up Ground Control Points (GCPs)
Standard drone GPS has horizontal errors of about 10–16 feet and vertical errors of 16–33 feet. Ground Control Points (GCPs) serve as precise anchors, reducing these errors to as little as 1–3 cm horizontally and 2–5 cm vertically [5][6]. This level of precision is essential for tracking crop changes over time and creating reliable management zones to boost yields.
For most farms, use at least five GCPs - one at each corner and one in the center - to avoid the "bowling effect", where map edges appear curved. In fields with varied terrain, such as hills or valleys, place GCPs at different elevations to help software accurately model the landscape [5][7]. Position them 50–100 feet inside your flight boundary so they appear in enough overlapping images.
Opt for high-contrast, matte checkerboard patterns for GCP targets, as glossy materials can create glare that obscures the center point. Each marker should cover at least 50 pixels in your drone imagery for clear identification, and trim any nearby tall grass or weeds to keep the markers visible.
Instead of using a phone or tablet to record GCP coordinates, rely on professional-grade RTK or PPK GNSS receivers for centimeter-level accuracy. For non-RTK drones, use one GCP for every 60 images; RTK-enabled drones typically need only one GCP for every 200 images. Research indicates that accuracy improvements level off after placing 5–10 well-positioned GCPs.
| Survey Area Size | Minimum GCPs | Recommended GCPs |
|---|---|---|
| Under 10 acres | 3 | 5 |
| 10–50 acres | 5 | 7–10 |
| 50–200 acres | 8 | 12–15 |
| Over 200 acres | 10 | 15–20 |
Proper GCP placement is the backbone of accurate map stitching and reliable analysis.
Processing and Analyzing Drone Data
Once you've collected high-quality drone imagery, the next step is to process that data into actionable insights. This involves transferring the files to your computer, checking the image quality, and organizing everything properly. Keep in mind, a typical project may require about 3 GB of storage for every 50 acres of land, so plan your storage needs accordingly [9]. The processed data then serves as the backbone for analyzing vegetation health and field structures in detail.
Generating and Interpreting NDVI Maps
NDVI, or Normalized Difference Vegetation Index, is a tool for assessing plant health by measuring how plants reflect near-infrared light versus how much red light they absorb. The resulting values range from -1 to +1, with readings below 0.1 indicating bare soil or water, 0.2–0.4 signaling stressed vegetation, and values above 0.6 representing healthy, dense growth [10].
To ensure accuracy, perform radiometric calibration using a reflectance panel or sunshine sensor before creating NDVI maps. This step standardizes reflectance values across varying lighting conditions [9].
One of NDVI’s strengths is its ability to detect problems before they’re visible to the naked eye. For example, researchers at the University of New Hampshire used multispectral drone imagery to identify fungal diseases in Brown-Midrib corn weeks before symptoms appeared on the ground [10]. However, NDVI has its limits - it can "saturate" in dense canopies during late-season growth. For these situations, especially when making nitrogen decisions close to harvest, NDRE (Normalized Difference Red Edge) is a better alternative as it provides deeper insights into thick crop canopies [10].
When interpreting NDVI maps, patterns can tell you a lot. For instance, uniform yellowing in a zone might indicate nitrogen deficiency, while streaks along equipment paths could point to soil compaction [11]. In Louisiana SARE trials, cotton farmers used NDVI-based prescriptions to maintain yields of 1,288 lb/ac while cutting nitrogen use by half - from 30 lb/ac to just 15 lb/ac [10].
| NDVI Range | Interpretation | Suggested Action |
|---|---|---|
| > 0.6 | Healthy, dense vegetation | Monitor as usual; no action needed |
| 0.4–0.6 | Moderate health or stress | Check irrigation and nutrients |
| 0.2–0.4 | Sparse or severe stress | Investigate for pests or disease |
| < 0.1 | Bare soil or water | No action required |
Creating Orthomosaic Maps
Orthomosaic maps provide a comprehensive view of your field by stitching together hundreds of drone images into a single, high-resolution, georeferenced map. These maps are geometrically corrected, ensuring that each pixel corresponds to a precise location in the real world. This makes them incredibly useful for measuring distances, calculating acreage, and identifying problem areas.
The process involves photogrammetry software, which aligns overlapping images by identifying shared features, creating a seamless mosaic. For example, Babe Farms in California used a 7-minute drone flight over 8.47 acres of baby lettuce to generate Chlorophyll Index Green (CIG) maps. These maps revealed nutrient differences across the field, enabling precise fertilizer application [11]. The efficiency is remarkable: a fixed-wing drone can survey 100 acres in just 20 minutes, compared to the 1.5 hours it would take to walk and scout 40 acres [10].
Using Software for Data Analysis
Choosing the right software is crucial for processing drone data effectively. Here are a few options:
- Pix4Dfields: Processes data offline on a laptop, allowing you to create Variable Rate Application (VRA) shapefiles in minutes. Perfect for quick, in-field decisions.
- Agremo: Uses AI to assess plant vigor and detect weeds. Its prescription maps integrate seamlessly with DJI Agras drones for precision spraying.
- Solvi: A cloud-based tool offering 1-meter resolution analytics for whole-farm management [10].
"Agremo's AI solution turns DJI's drone imagery into actionable insights, and its recipe maps make our AGRAS drone a truly intelligent and precise spraying tool."
- DJI Agriculture [8]
Most platforms export files in formats like SHP, RX, or GeoTIFF, which are compatible with modern sprayers and spreaders. Studies show that using these tools can cut fertilizer costs by 10–15% without sacrificing yields. Additionally, thermal drone data has been shown to reduce water use by 15–20% [11].
When selecting software, look for tools that support multiple vegetation indices beyond NDVI, such as GNDVI for detecting chlorophyll variation and CIG for sensitivity during early growth stages. Testing free trials can help ensure the software works with your drone’s camera and exports files that are compatible with your equipment [12].
Integrating Drone Data with Historical Farm Data
Bringing together drone imagery and long-term farm records transforms agriculture from a reactive process into a predictive science. By creating a unified dataset, you can apply machine learning to forecast yields and fine-tune resource management.
Using Historical Yield and Soil Data
Long-term harvest records are the backbone of accurate yield predictions. When combined with NDVI maps and several years of soil and nutrient data, patterns emerge that enable smarter decisions about inputs using precision sprayer drones. Tools like ArcGIS streamline this process, using features like "Zonal Statistics" to extract average values from drone imagery and merge them with historical field boundaries, creating a cohesive dataset for analysis.
In February 2025, Aidan Thurling from Esri’s commercial agriculture team developed a sugarcane yield forecasting model. This model combined seven years of harvest data, regional soil data, and Sentinel-2 satellite imagery. The analysis pinpointed NDVI mean values from six months prior to harvest as the most critical predictor. Thurling explained:
"The opportunity to forecast yield values can provide invaluable insight from year to year - It enables growers to predict profit margins and strategically adjust their field management over the course of the growing season" [13].
The level of detail in your data matters. Drone imagery offers a resolution of 0.1–5 cm per pixel, capturing fine details, while satellite imagery provides a broader perspective at 10–30 meters per pixel. To make these datasets compatible, map all attributes - such as drone imagery, soil maps, and yield records - onto a shared spatial grid (commonly 8 ft x 8 ft) using interpolation methods. This ensures machine learning models can effectively analyze the relationship between high-resolution aerial data and historical field performance.
Incorporating Climate and Irrigation Records
Adding climate data helps differentiate between stress caused by management practices and stress due to weather conditions. For example, researchers Thompson and Puntel integrated drone imagery with historical field and climate data, reducing nitrogen application by about 28 lb/acre (31 kg/ha) without sacrificing crop productivity [14].
Datasets like TerraClimate offer solar radiation, precipitation, and temperature records, which enhance forecast accuracy. Aligning imagery with growth stages using Growing Degree Days (GDD) makes comparisons more precise. For instance, a cornfield photographed at 800 GDD in 2024 can be directly compared to imagery taken at the same GDD in 2025, even if the dates differ by weeks.
Irrigation records are equally important. Historical water usage data paired with thermal drone imagery can reduce water consumption by 15–20% [11]. In Esri's sugarcane model, irrigation method ranked among the top factors influencing yield predictions, alongside soil moisture and solar radiation [13].
Using Machine Learning for Yield Predictions
With these integrated datasets, machine learning models can uncover subtle yield patterns. Random Forest and XGBoost models, for example, can analyze drone metrics like NDVI, VARI, and thermal stress alongside historical data such as soil moisture and nutrient applications. These models have achieved prediction accuracies with an R² value of 0.83 [14].
In 2021, researchers at a maize breeding facility in Nong'an County, China, used a two-stage approach. First, they classified yield potential into categories (low, medium, high) using Support Vector Machines. Then, they applied class-specific Random Forest regression, reducing the calibration RMSE from 0.51 t/ha (about 455 lb/acre) to 0.28 t/ha (around 250 lb/acre) across 72 test plots [15].
Timing drone flights is crucial for accurate predictions. For long-cycle crops, mid-season data often correlates best with final yields, while imagery taken near harvest is less effective for management adjustments. Tools like SHAP can help identify which variables - such as mid-season NDVI, irrigation methods, or soil moisture - have the most impact on yield. This allows you to focus data collection where it counts [13][14].
| Data Type | Spatial Resolution | Best Use for ML Models |
|---|---|---|
| Drone Imagery | 0.1–5 cm/pixel | Real-time health monitoring and plant height estimation |
| Satellite Data | 33–98 ft/pixel | Large-scale trend analysis and historical context |
| Historical Yields | Field-level | Baseline performance and training datasets |
| Climate Records | Regional | Risk management and stress differentiation |
| Soil Maps | Variable | Establishing management zones and nutrient planning |
These combined insights set the stage for yield optimization strategies, which are explored in the next section.
Applying Insights for Yield Optimization
Once you've developed your yield forecasts, the next step is turning those insights into actionable strategies for better results. This involves dividing your fields into management zones, applying inputs with precision, and keeping track of outcomes throughout the growing season.
Creating Management Zones
Management zones are sections of a field that share similar characteristics, such as soil quality or crop performance [31,32]. By analyzing NDVI imagery, soil test results, and historical yield data, you can identify which areas need more inputs and which require less. This method, often called "yield synergy", aims to optimize returns by tailoring input rates to each zone [16].
"Yield synergy is defined as applying the right rate of multiple products to achieve a higher return in specific parts of the field, rather than applying more or less of one product at one rate on a whole field."
- Kevin Kruize, Premier Crop Systems [16]
In high-yield zones, increasing fertility and plant populations can push productivity even further. For lower-yield areas, reducing inputs can cut costs and avoid overcrowding. Advanced tools, such as AI-powered weed detection or plant vigor analysis, offer even more accuracy than basic NDVI data, making input applications even more precise [8].
To get started, layer NDVI maps with soil test data. Over time, as you gather more information - like climate data, yield records, and soil metrics - you can refine these zones for better accuracy [16]. Tools like DJI Terra, DroneDeploy, and Pix4Dfields can help create field boundaries and generate maps, while platforms like Agremo can produce variable rate application (VRA) maps in a format compatible with DJI Agras spraying drones [8]. For fertigation, including data like soil conductivity, slope, and organic matter in your maps ensures nutrients are applied efficiently and accurately [17].
| Step | Action | Tools/Data Sources |
|---|---|---|
| 1. Mapping | Create field boundaries and upload orthophotos | DJI Terra, DroneDeploy, QGIS |
| 2. Analysis | Perform AI weed detection or plant vigor analysis | Agremo, Premier Crop Systems |
| 3. Zoning | Divide fields into zones based on productivity | Agremo, Sentinel Fertigation |
| 4. Prescription | Generate VRA maps for specific inputs | Agremo, DJI Pilot 2 |
| 5. Execution | Use drones for autonomous spraying | DJI Agras T40/T50, RTK Dongles |
Once your zones are ready, the next step is applying inputs with precision tools, including drones.
Optimizing Spraying with Drone Technology
Variable rate application (VRA) uses data and AI to apply inputs - such as herbicides, pesticides, or fertilizers - only where they're needed [15,34]. This targeted approach avoids waste and ensures better results. For example, AI-powered weed detection excels in "green-on-green" scenarios, where weeds and crops are hard to differentiate using traditional methods [15,34].
For spraying, drones like the DJI Agras T40 or T50 are excellent tools. Before use, ensure the "DJI folder" from your prescription map is unzipped and loaded into the drone’s controller [8]. For larger fields, consider combining high-capacity drones (like the Talos T60X) with smaller, more agile models like the DJI Agras T50 or T40 to handle irregular zones efficiently [18]. RTK-enabled drones and accessories, such as RTK dongles, also ensure consistent application and accurate field boundaries [15,33].
A demonstration by Iowa State University's Digital Ag Innovation Lab in December 2024 highlighted the potential of drone-generated prescriptions. By loading a prescription into a John Deere ExactApply sprayer, they reduced tank mix usage by 50% - from 130.5 gallons to 70 gallons - saving $13.42 per acre and achieving a 94% weed mortality rate without affecting grain yield [21].
Monitoring and Adjusting Throughout the Season
Constant monitoring ensures you can adapt quickly to changing conditions. For example, early-season stand counts for corn and soybeans can now be done autonomously, covering 100 acres in just 15 minutes - saving up to 90% of the time and cost compared to manual methods [2].
Real-time crop health maps can reveal nitrogen deficiencies, guiding precise fertilizer applications [20]. Flying drones over your fields regularly allows you to compare seed varieties or chemical treatments using before-and-after imagery [6,35]. Multispectral and RGB imagery can also help pinpoint areas affected by pests, weeds, or disease. Tagging photos to these maps makes ground-truthing more accurate, and follow-up flights after treatments confirm their effectiveness [20].
Drones also prove invaluable after extreme weather. For instance, they can document crop damage - like downed corn - for insurance claims and help you make quick management decisions [20].
"The biggest benefit for farmers who use drones and Agremo reports is that they increase their yields, reduce costs or improve their productivity."
- Ciprian Iorga, Partner at Agremo [8]
Finally, tools like Live Map enable real-time crop health mapping along field edges, allowing for immediate adjustments. When creating VRA maps for systems like XAG drones, ensure compatibility by using a 5×5 meter tile size and limiting zones to three [19].
Conclusion
Drone technology is transforming how we optimize crop yields by enabling precise, real-time decision-making. With high-quality imagery turned into actionable maps and insights seamlessly integrated with historical farm data, farmers can make data-driven choices that enhance productivity and conserve resources. Drones now provide real-time predictions of yield potential based on current field conditions [22].
For example, drone-assisted data analysis has been shown to increase wheat yields by up to 15% [1]. Tasks like autonomous stand counts, which used to take hours or even days, can now be completed in just 15 minutes for 100 acres, slashing 90% of the time and cost compared to manual methods [2]. When paired with variable rate application, drones also enable precision spraying, reducing input costs while maintaining - or even improving - crop performance.
"As the world grapples with the dual challenges of feeding a growing population and combating climate change, drones offer a way forward towards sustainable, efficient, and high-yielding agriculture."
- Jacob Stoner, CEO, Flyeye.io [1]
If you're new to drones, start with a scouting drone to build a visual library of your fields. Combine this data with soil tests and yield records to get a fuller picture of your farm's needs. As you grow more comfortable, consider adding spray drones like the DJI Agras T40 or T50 for targeted applications. Companies like Drone Spray Pro offer complete packages, FAA licensing support, and training to help you make the most of these tools.
FAQs
How often should I fly drones to improve yield decisions?
The timing of drone flights largely hinges on specific crop management objectives and seasonal demands. Crucial periods include early spring for tasks like soil analysis and pre-planting mapping. Additionally, monitoring during critical growth stages is essential for assessing crop health. For instance, in crops such as corn, flying at stages like V4 or V10 provides timely insights, helping farmers make informed decisions. Scheduling flights to align with these growth milestones ensures more effective data collection and supports efforts to maximize yield.
Do I need RTK/PPK or GCPs for accurate maps?
For accurate drone mapping, incorporating Ground Control Points (GCPs) is highly recommended, particularly for projects that demand high global accuracy, such as overlays or integrating designs. Although RTK/PPK technology can deliver precise data directly from the drone, GCPs are often employed to improve accuracy when RTK/PPK isn't an option or to complement it. The choice depends on your equipment and the specific requirements of your mapping project.
How do I turn NDVI maps into variable-rate prescriptions?
To develop variable-rate prescriptions using NDVI maps, start by analyzing the data to pinpoint areas with varying crop health or nutrient requirements. Utilize specialized software to create Variable Rate Application (VRA) maps that correspond to the NDVI values. These maps should outline specific application rates for inputs like fertilizers, pesticides, or herbicides. Once the maps are ready, export them to your drone. The drone will then automatically adjust spray rates, ensuring accurate and efficient application tailored to each zone's needs.