Call or Text: +1 (208) 425-2990
Email: Sales@DroneSprayPro.com

Thermal Camera Drones for Pest Stress Detection
Thermal drones help me find crop stress early, but they do not tell me which pest caused it. What they do well is show hotspots fast, so I can send scouts to the right acres, rows, trees, or vine sections instead of checking everything by foot.
Here’s the short version:
- Thermal cameras read canopy temperature
- Hotter plants often mean stress
- The temperature gap vs. healthy plants matters more than one raw reading
- Thermal works best as a scouting tool, not a diagnosis tool
- Ground checks should happen within 24 to 48 hours
- RTK GPS can tighten map accuracy from about ±1.5 to 3 meters to about ±1 centimeter
- CWSI values above 0.6 point to severe stress
- A 640×512 radiometric sensor or better gives more usable field maps
- Commercial imaging in the U.S. needs FAA Part 107
- Spraying by drone also needs FAA Part 137 and state spray rules
If I had to boil the whole process down, it would look like this:
- Fly at the right time - usually mid-morning to early afternoon, after dew dries
- Use a thermal sensor that stores temperature per pixel
- Look for stress patterns, not pest IDs
- Compare hot zones to irrigation layout, soil shifts, and healthy crop nearby
- Walk the hotspot before spraying
- Turn confirmed problem spots into geo-referenced spray zones using a high-capacity DJI Agras T50 Sprayer Drone
A thermal map is best for one job: cutting down the scouting area. If a hot patch does not match irrigation lines, pivot zones, or terrain, and it stays warm across flights, that area moves to the top of my field-check list.
| Step | What I’m looking for | What I should not assume |
|---|---|---|
| Fly | Clear thermal contrast | One flight tells the whole story |
| Map | Localized warm zones | Heat always means pests |
| Compare | Pattern vs. water/soil layout | Thermal gives the cause |
| Scout | Eggs, larvae, feeding, lesions, roots, moisture issues | A hotspot means “spray now” |
| Spray | Tight treatment polygons with ABZ Innovation L30 RTK alignment | Rough GPS is enough for row-level work |
Put simply, thermal drones help me find where to look first, then I confirm the cause on the ground before I spray.
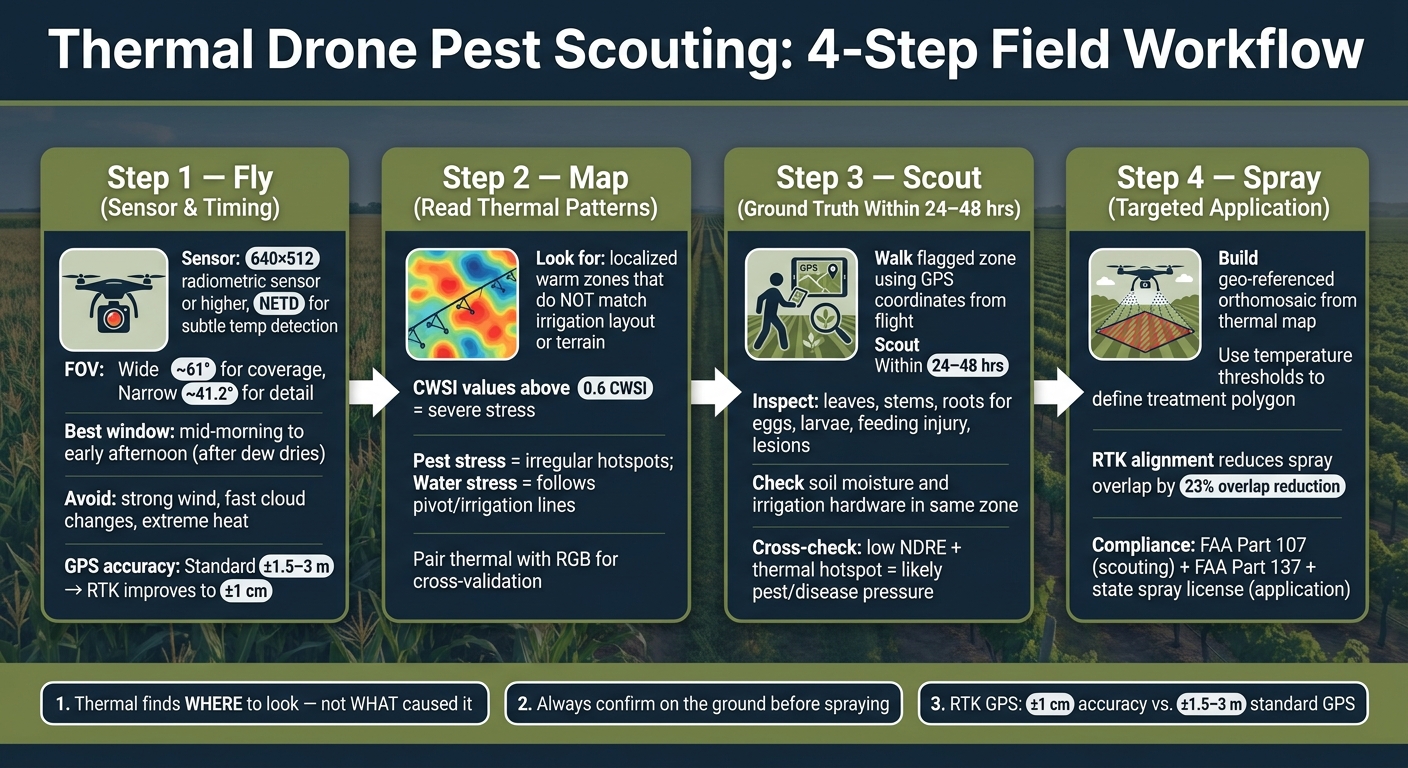
Thermal Drone Pest Scouting: 4-Step Field Workflow
Step 1: Pick the Right Thermal Sensor and Flight Plan
Sensor specs that affect farm results
Not all thermal cameras are the same. And when you're trying to spot early pest stress across large acreages, those differences can change what you see in the field.
The first thing to look for is radiometric data, which stores a temperature value for each pixel. That gives you a cleaner way to compare readings across flights and fields. Next comes resolution. Go with 640×512 or higher if you want to pick up small stress patches [6].
Why does that matter? Because small infestations often begin with slight temperature shifts. If the sensor can't pick up those small changes, you may miss the problem until it spreads.
Thermal sensitivity, or NETD, also matters because it affects how well the sensor detects subtle temperature differences. Lens FOV controls coverage versus detail: wider covers more ground, narrower shows finer heat differences. A wider FOV, around 61°, lets you cover more ground per pass. A narrower FOV, around 41.2°, gives sharper heat definition at distance [6]. That's helpful when you need more detail from a higher flight.
It's also smart to pair thermal with RGB. Use thermal to spot stress, then use RGB to check whether that hotspot looks like pest pressure before you act.
The point isn't just better-looking imagery. It's making cleaner calls in the field.
Flight timing, height, and weather checks
Thermal timing can make or break the data. The best window is usually mid-morning to early afternoon, after dew dries. Wet leaves can throw off thermal readings and flatten the temperature differences you're trying to spot. More uniform canopy conditions make it easier to separate real stress from normal temperature swings.
Flight height is a balancing act. Higher flights cover more acres per battery, but you lose detail. Lower flights give you a closer look at small stress patches, especially when paired with a narrower FOV sensor.
A few weather checks matter here too:
- Avoid strong wind
- Avoid fast cloud changes
- Avoid extreme heat
Those conditions can reduce thermal contrast and make the map harder to trust.
GPS accuracy and U.S. compliance
A thermal map only helps if you can act on it with precision. GPS accuracy matters because spray zones need to match the stressed area, not just a rough hotspot. Standard GPS on most consumer drones usually lands in the ±1.5 to 3 meters range. That's enough to find the general area, but not enough to line up a spray drone with specific rows or plant zones [3].
RTK (Real-Time Kinematic) GPS closes that gap. Under stable conditions, it can deliver horizontal accuracy down to ±1 centimeter [3]. That kind of precision lets a thermal scouting map transfer much more cleanly to a spray drone mission. It also supports row-level spray alignment and less spray overlap. In fact, RTK use has been linked to a 23% reduction in spray overlap [3].
"RTK GPS can drop from centimeter-level accuracy to inches, or even feet, when wind, clouds, or heat change fast." - Drone Spray Pro [5]
There are also U.S. rules to keep in mind. Commercial drone imaging requires an FAA Part 107 license. If the job moves from scouting to chemical application, it also falls under FAA Part 137 plus state spray licensing rules [5].
With the sensor, timing, and GPS dialed in, the next step is telling pest-linked stress apart from other canopy problems.
sbb-itb-3b7eef7
Step 2: Use Thermal Drones to Find Stress Patterns Linked to Pests
Water stress, pest pressure, and disease hotspots
Once your sensor and flight plan are dialed in, the job shifts to pattern reading. The goal is simple: tell pest stress apart from water issues or disease.
A thermal map shows where stress is happening, not why. Warmer zones often appear days or even weeks before wilting or yellowing shows up to the eye [1][4]. CWSI can help measure canopy stress, but out in the field, the shape and location of the hot spots usually matter more than the exact score.
This is where context does the heavy lifting. Irrigation trouble and pest pressure can look almost the same on a thermal map at first glance. Water stress tends to follow a pattern. It often lines up with irrigation equipment, pivot zones, or soil shifts like sandy knolls. Pest stress is usually messier. It often shows up as small hot spots that don’t match irrigation layout or terrain [1][2].
Any hot zone that stays warm even when moisture is adequate should move to the top of your scouting list. The best move is to check it on the ground within 24 to 48 hours after the flight [1].
Common uses by crop type
Crop type changes where you’ll see hot spots, but not how you use them.
In corn and soybeans, pest stress often appears as small warm areas that don’t match irrigation zones or terrain. Those spots are your cue to check for feeding injury, root damage, or disease [1][2][4]. In orchards and vineyards, thermal maps help narrow the search so you can inspect the right trees or vine sections instead of walking the whole block.
The map doesn’t make the diagnosis for you. It cuts down the search area. Then you confirm the cause on the ground and decide whether the issue calls for targeted spraying or more monitoring. That’s why reading the images well matters so much in the next step.
Drone Series 2024: Next-Generation Pest Management Tools
Step 3: Read Thermal Maps the Right Way and Confirm the Cause
Once thermal scouting finds a hotspot, the next step is figuring out whether you're looking at actual stress or just noise.
How to read hotspots without overreacting
A thermal map is a starting point, not a final call. Compare each hotspot against a healthy reference area, and only flag anomalies that show up again across flights as confirmed anomalies worth acting on.
Use CWSI as a trend marker: higher values point to more stress. Repeated flights show whether a hotspot is getting worse or staying about the same.
What thermal can and cannot show
Thermal imagery can flag stress linked to pests, water limits, or other issues, but it can't tell you the cause on its own.
That’s where cross-checking comes in. If a hotspot also shows low NDRE, pest or disease pressure becomes more likely. If the thermal anomaly shows up but NDRE still looks normal, an abiotic cause is more likely.
Pattern and placement are your best filters here. Field-wide warming often lines up with irrigation equipment, pivot zones, or soil changes. Localized stress that doesn’t match terrain or irrigation layout is what you should move to the top of the list for ground inspection.
| Cause | Likely thermal pattern | What thermal cannot confirm |
|---|---|---|
| Water stress | Field-wide warming tied to irrigation or soil | Exact failure point |
| Pest or disease | Localized or expanding hotspots | Specific pest or pathogen |
| Soil-related stress | Persistent warm zones repeating across flights | Whether soil is the only cause |
Check the map on the ground before spraying
Use the map to narrow your search, then confirm the cause before making any spray call.
Walk straight into the flagged zone using coordinates from your flight. Inspect leaves, stems, and roots for feeding injury, lesions, eggs, or larvae [1]. Check soil moisture and irrigation hardware in the same area too, because an irrigation issue can create a thermal signature that looks a lot like pest pressure [1].
Once you confirm the cause, you can turn the hotspot into a spray zone with much less wasted coverage.
Step 4: Turn Thermal Scouting Into Targeted Spray-Drone Work
From hotspot map to spray zone
Once ground checks confirm pest pressure, turn the hotspot into a spray zone. Build the thermal map into a geo-referenced orthomosaic so every pixel has a GPS location. Then use temperature thresholds to separate stressed canopy from the healthy crop around it. From there, fit the treatment polygon to the spray drone's swath and navigation accuracy. Before spraying, check wind speed and direction to make sure conditions fall within the drone's operating limits.
That map only helps if the spray drone can follow it with precision.
Equipment, batteries, and support for scouting and spraying
RTK keeps the spray path lined up with the treatment polygon. Batteries shape how much ground you can cover in each run. Chargers set the pace for turnaround time between runs. And training makes sure the whole setup works as planned from the first flight.
Drone Spray Pro offers agricultural spray drones, RTK dongles, batteries, chargers, FAA licensing support, and hands-on training to connect scouting with application.
FAQs
How early can thermal drones catch pest stress?
Thermal drones can help spot stress early by picking up physiological changes before a person can see them in the field. By tracking canopy temperature, they can show water stress 5 to 7 days earlier than visual scouting.
When plants are under stress, they often close their stomata. That cuts evaporative cooling and makes leaf temperature go up. Catching those heat shifts early can help growers time irrigation or treatment before wilting or yellowing shows up.
Can thermal maps separate pests from irrigation problems?
Not on their own. Pest pressure and irrigation trouble can both push plants to close their stomata and heat up. So a thermal map may flag stress, but it won’t always tell you why the plant is stressed.
For a clearer read, pair thermal data with multispectral imagery. That extra layer gives AI tools more to work with, helping them tell pest-linked spectral patterns apart from signals that tend to point to water stress.
What drone setup do I need for spray-zone accuracy?
For spray-zone accuracy, you need a setup that pairs precise field mapping with automated application. The goal is simple: know exactly where the problem is, then spray ONLY in those spots.
Use a drone with RTK GPS for centimeter-level positioning. Add thermal or multispectral sensors to spot stress zones and build a prescription map based on what the crop is showing you.
Then send in a spray-capable drone, such as the DJI Agras series, to follow that map and apply inputs only where they’re needed.
