Call or Text: +1 (208) 425-2990
Email: Sales@DroneSprayPro.com

How Multispectral Sensors Guide Spray Plans
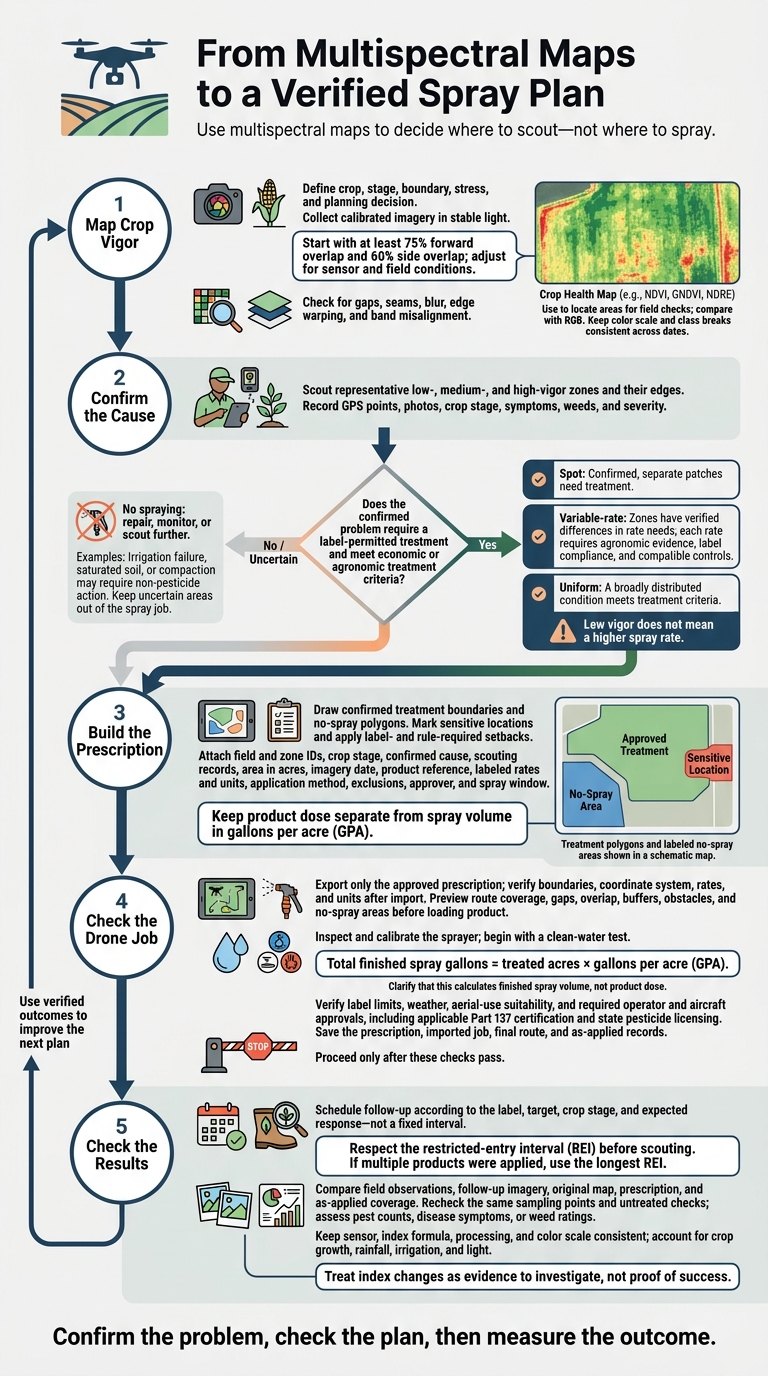
I use multispectral maps to decide where to scout - not where to spray. My starting point is calibrated imagery, with at least 75% forward overlap and 60% side overlap, adjusted for the sensor and field.
Here’s how I turn those maps into a spray plan:
- Map crop vigor: Check image quality and use NDVI, GNDVI, or NDRE to locate areas for field checks.
- Confirm the cause: Scout before choosing spot, variable-rate, uniform, or no treatment. Low vigor does not mean a higher spray rate.
- Build the prescription: Set treatment boundaries, label-approved rates, and <u>no-spray areas</u>.
- Check the drone job: Verify file imports, route coverage, sprayer calibration, weather, label limits, and operator credentials.
- Check the results: Compare field observations, follow-up imagery, and as-applied records after the required reentry interval.
The rule I follow: confirm the problem, check the plan, then measure the outcome.
From Multispectral Maps to a Verified Spray Plan
Collect Imagery and Create Crop-Health Maps
Plan the Mapping Flight
Start by defining the crop, growth stage, field boundary, suspected stress, and spray-planning decision the map will support. These details guide your sensor bands, flight timing, and ground sample distance (GSD). Check that the sensor records every band your chosen index needs. When possible, schedule repeat flights at similar times of day and comparable crop stages. For seasonal comparisons, also account for canopy development.[6][7]
Fly a nadir grid, with the camera pointed straight down, at a consistent altitude and speed. Start with at least 75% forward overlap and 60% side overlap, then adjust based on sensor and processing guidance. Low-texture crops and uneven terrain may need more overlap.[6][8][9] Extend coverage beyond field edges where safe and permitted.
Follow the manufacturer’s reflectance-calibration procedure. If supported, photograph the reference panel immediately before and after the mission.[6][11][12][13][18] Fly in stable light - full sun or even overcast - and avoid rain, haze, moving cloud shadows, and wind blur.[9][10]
Before takeoff, check batteries, storage, time sync, positioning, access, obstacles, and weather. Log the crop stage, sensor model, altitude in feet, expected GSD, speed, overlap, calibration, and positioning. Record the date in U.S. format (MM/DD/YYYY).
Process Images and Choose Vegetation Indices
Turn the flight images into a map you can use for scouting.
Import the original geotagged images, reference-panel images, and any RTK or ground-control data. Calibrate and align the images, build band orthomosaics, and calculate your selected indices. Check for gaps, seams, blur, edge warping, and band misalignment before interpreting patterns.[6][10][14][16] Clip the final map to the field boundary to focus the next step on actual stress zones.
| Index | Principal bands | Use | Limit |
|---|---|---|---|
| NDVI | Red and near-infrared (NIR) | Assess green biomass, canopy vigor, and vegetation cover | Soil, weeds, shadows, and mixed pixels affect values. Dense canopies may saturate, often near 0.7–0.8.[7] |
| GNDVI | Green and NIR | Indicate chlorophyll- or nitrogen-related vigor differences | The link to chlorophyll or nitrogen varies by crop, canopy, and light. Confirm with field checks.[13][14] |
| NDRE | Red-edge and NIR | Detect subtler chlorophyll and vigor differences in developed or dense canopies | Requires an appropriate red-edge band. Soil, shadows, weeds, canopy density, and interacting stresses affect values.[14][15] |
Compare the index map with RGB imagery before marking scouting points. Look for exposed soil, weeds, canopy gaps, and shadows that could affect the readings.
Use the same color scale and class breaks across dates. Automatic rescaling can make unchanged conditions look different. Keep flight and processing settings consistent, and save raw images, calibration files, the software version, index settings, and export settings. Export the clipped maps with their legend and coordinate reference system, and clearly mark any unreliable areas for the next field review.[15][17]
sbb-itb-3b7eef7
Confirm Stress Causes and Define Treatment Areas
Scout Stress Zones Before Choosing Treatment
Visit representative low-, medium-, and high-vigor zones, including the edges between healthy and stressed plants. Compare field patterns with RGB imagery, irrigation layouts, drainage features, traffic lanes, nutrient records, and recent pest or disease observations. Record GPS points, photos, date, crop stage, symptoms, weeds, and severity. These notes help separate stress you can treat from problems that need field repair or further monitoring. Also check whether the imagery date still reflects current field conditions.
Identify the cause before choosing a treatment. Irrigation failure, saturated soil, or compaction may need irrigation repair, drainage work, or traffic changes - not pesticides. For a treatable pest, disease, weed, or other condition, check the economic or agronomic threshold. Then confirm that the product label allows the crop, target, application method, and growth stage. Check labeled rates, seasonal limits, preharvest and reentry intervals, and treatment restrictions.
Use that diagnosis to decide whether the zone needs spot, variable-rate, uniform, or no treatment.
Choose Spot, Variable-Rate, or Uniform Spraying
Once scouting confirms the cause, choose the spray method. Low index values do not justify higher rates. Use variable-rate spraying only when each zone has a label-compliant rate supported by agronomic evidence. Before building the prescription, verify that the drone and controller support the boundaries, on/off control, and rate changes.
| Use when | Spray method | Required data | Complexity | Primary benefit | Principal risk |
|---|---|---|---|---|---|
| Confirmed, separate patches need treatment | Spot | Validated treatment polygons, accurate positioning, field observations, on/off control | Moderate to high | Applies the prescribed rate only within targets | Missed patches or overspray along edges |
| Zones have verified differences in rate needs | Variable-rate | Zone recommendations, label-compliant rates, compatible controller | High | Matches application rate to documented need | Unsupported rates or inaccurate zone transitions |
| A broadly distributed condition meets treatment criteria | Uniform | Representative scouting, treatment boundary, labeled rate | Low to moderate | Maintains one rate across the treatment area | Unnecessary treatment of unaffected areas |
Draw Treatment Boundaries and No-Spray Areas
Turn the confirmed zones into treatment and no-spray polygons. Mark uncertain areas separately and leave them out of the spray job until further scouting. Mark roads, waterways, wells, buildings, neighboring crops, livestock areas, habitat, and other sensitive locations identified during scouting or in the product directions.
Combine small polygons only when their spacing and shape, controller response, and label limits allow accurate coverage without excess overlap. Set setbacks using the label and governing rules, following the greatest applicable labeled spray-drift buffer.[19]
Attach field and zone IDs, crop stage, confirmed cause, scouting records, boundary geometry, area in acres, imagery date, product reference, labeled rates and units, application method, and exclusions. Keep product dose separate from spray volume in gallons per acre, and retain the label’s required units. Record the approver and spray window so the operator receives a documented prescription, not just a map.
Turn the Prescription Into a Spray-Drone Job
Once the prescription is approved, turn its confirmed treatment zones and no-spray areas into a drone job file. Then check that the file matches the map.
Import the Prescription and Check the Route
A crop-health map is not a spray prescription. Export only the approved prescription in a format supported by your drone, controller, and mission software. Keep the field boundary, zone data, and coordinate system intact.
After import, compare the file with the source map. Use field corners, roads, waterways, and crop rows as reference points. Check sample points in every zone for shifted boundaries, missing polygons, incorrect rates, and unit errors.
Preview the route before loading product. Look for coverage gaps and overlap, and check buffers, no-spray areas, power lines, trees, buildings, and neighboring crops. Confirm takeoff, landing, emergency landing, and refill locations, along with battery limits.
Calibrate the Sprayer and Review Application Rules
Once the job file passes review, check the sprayer before loading product. Its settings must match the approved treatment boundaries and rates.
Inspect the tank, pump, hoses, filters, valves, flow meter, and nozzles or atomizers. Match measured output to controller settings at the planned speed, altitude, pressure, and swath width. Start with a clean-water test to check rate, flow, treated area, droplet settings, and coverage.
Calculate total finished spray gallons = treated acres × gallons per acre (GPA). Use the label rate to calculate the product amount, then estimate refill needs. Estimate battery swaps using similar test flights. Stage water, batteries, chargers, protective equipment, and spill supplies at the refill point. Move the job to final preflight approval only after these checks pass.
Immediately before spraying, verify aerial-use suitability, carrier volume, droplet size, release height, and weather restrictions. Check wind direction and speed, temperature in °F, humidity, inversion risk, and nearby sensitive areas.[23] Confirm applicable Part 137 certification, pilot credentials, aircraft requirements, airspace approvals, exemptions, and state pesticide licensing.[20][21][22]
Save the original prescription, imported job file, final route, and as-applied paths. Also record zone rates, actual acreage, weather, product amounts, equipment settings, refill events, skipped areas, and manual changes.
Check Equipment Support and Training Needs
If you buy equipment or training support, require a live demo using your prescription file on the exact drone and software you plan to use. Check import, variable-rate control, no-spray-zone handling, offline use, and as-applied export.
RTK can improve positioning, but it does not replace sensor or sprayer calibration, scouting, or operator approvals. Licensing support does not authorize operations.
Conclusion: Check Results and Improve the Next Spray Plan
Review calibrated imagery, ground-checked zones, treatment boundaries, flight logs, and as-applied records. A cleaner map does not prove the treatment worked.
After ditching the crop dusters and spraying with a drone, schedule follow-up based on the label, target, crop stage, and expected response time - not a fixed interval. Respect the restricted-entry interval (REI) before scouting. If multiple products were applied, use the longest REI.[24]
At follow-up, overlay the new imagery with the original map, prescription, and as-applied coverage. Recheck the same sampling points and untreated checks. Look for improvements in pest counts, disease symptoms, or weed ratings in treated areas. Keep the sensor, index formula, processing, and color scale consistent, and account for changes in crop growth, rainfall, irrigation, and light.
Treat index changes as evidence to investigate, not proof of success. Keep the map sets, field observations, and job records. Use verified outcomes to set thresholds for the crop, growth stage, sensor, and local conditions - not a universal NDVI or NDRE cutoff.[5]
FAQs
How recent should my imagery be before spraying?
Schedule your mapping flight 24 to 72 hours before spraying. This keeps your spray plan aligned with current field conditions, including crop condition and weed pressure [1].
For reliable imagery, fly near solar noon or under consistent cloud cover. Both help reduce shadows that can distort your data [2][1].
How small can a treatment zone be?
For many heavy-lift spray drones, zones measuring about 3.3–6.6 feet per side (1–2 meters) are a starting point - not a fixed rule [1]. The minimum size depends on how cleanly your equipment turns spraying on and off in the field [1]. Some systems, including XAG drones, require tiles at least 16.4 feet per side (5 meters) [2][3]. Each zone must be large enough for a clean spray pass [4].
What if my maps and scouting results disagree?
Check flagged zones in person. Walk the field and inspect plants and soil. Multispectral maps help you know where to look, but field noise, irrigation issues, soil compaction, or sensor errors can affect the results.
If the maps show stress but plants and soil look healthy, adjust your detection thresholds. If scouting turns up problems the maps missed, refine your classification settings before finalizing the spray prescription. Verify the map’s georeferencing so your spray drone treats the right location.
