Call or Text: +1 (208) 425-2990
Email: Sales@DroneSprayPro.com

How to Use Flight Logs for Better Crop Insights
Flight logs from agricultural drones contain detailed data like GPS tracks, spray rates, flight paths, and weather conditions. This information helps farmers make better decisions by improving spray coverage, ensuring compliance with regulations, and analyzing crop health. To get started:
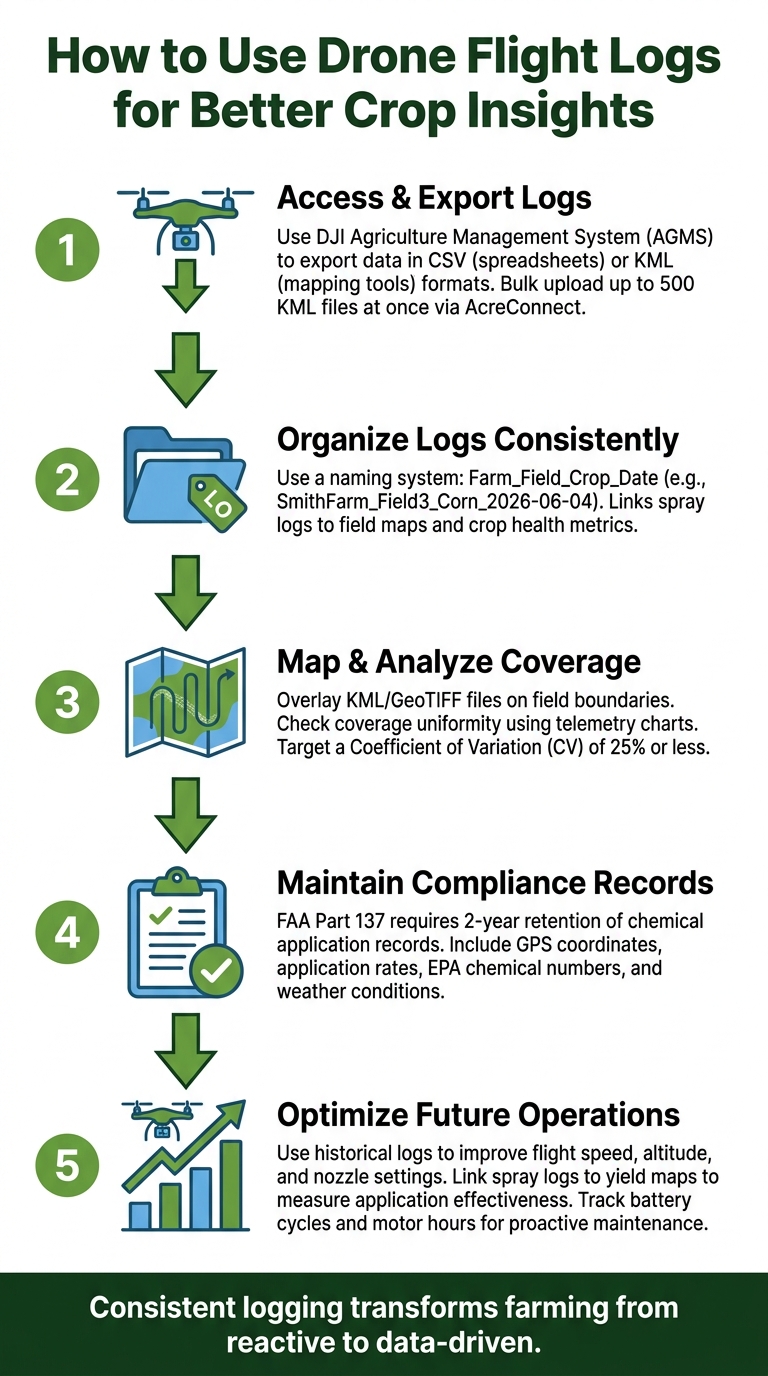
- Access and Export Logs: Use tools like DJI Agriculture Management System to export data in formats like CSV (for spreadsheets) or KML (for mapping tools).
-
Organize Logs: Use a consistent naming system (e.g.,
Farm_Field_Crop_Date) to keep records clear and easy to analyze. - Analyze Data: Overlay logs on field maps to check spray coverage and uniformity. Use telemetry data to identify inefficiencies or inconsistencies.
- Ensure Compliance: Maintain records for regulatory requirements, including application rates, chemicals used, and weather conditions.
- Plan and Improve: Use past logs to optimize future operations, track maintenance needs, and link spray data to crop outcomes.
How to Use Drone Flight Logs for Better Crop Insights
UAV Flight Log Analysis with MATLAB

How to Prepare and Manage Flight Logs
Turning raw drone data into actionable crop insights starts with properly preparing and managing your flight logs. The onboard data needs to be exported in a format ready for analysis.
How to Access and Export Flight Logs
If you're using DJI Agras drones, you can retrieve flight logs through the DJI Agriculture Management System (AGMS). Here's how it works: choose the flight date, find the field's route data, and export the log using the system's built-in tools. Typically, you'll export files in one of two formats:
- CSV: Ideal for spreadsheet-based analysis.
- KML: Perfect for use with mapping tools.
Once you've exported KML files, upload them to AcreConnect for further analysis and secure storage. AcreConnect highlights this feature:
"Users can easily manage their records by bulk uploading up to 500 DJI or XAG KML log files at a time." [1]
This bulk-upload option is a game-changer for managing data across multiple fields throughout an entire growing season. To streamline your workflow, establish a consistent file-naming system for all your logs.
How to Organize Logs for Farm Analysis
Exporting the logs is just the beginning. Organizing them systematically is key to efficient analysis. A good file-naming system should include details like the farm name, field ID, crop type, and application date. For example, a file named SmithFarm_Field3_Corn_2026-06-04 clearly identifies the farm, specific field, crop, and the date of application.
This naming approach not only helps you keep track of your data but also makes it easier to link spray logs with field boundary maps and crop health metrics during analysis. Plus, it simplifies compliance reporting and end-of-season reviews. A little organization upfront saves a lot of time later.
How to Analyze Spray Patterns Using Flight Logs
Flight logs are a treasure trove of data, capturing details like GPS coordinates, ground speed, flow rates, and altitude. This information is key to making precise adjustments in agricultural operations.
How to Map Flight Paths and Check Coverage
To start, upload your KML or GeoTIFF files into a mapping tool. This overlays the drone's flight path onto your field boundaries, making it easy to see if every row was covered or if gaps were left near edges, obstacles, or turn-around points. For compatibility, CSV files work well with spreadsheets and GIS software, while JSON files integrate seamlessly with modern farm management platforms. [4]
"Agricultural drone flight logs require CSV, JSON, and GeoTIFF formats for seamless analysis integration." - Kong, SkyRover Industrial Drones [4]
For a deeper dive, use platforms that offer 3D flight path replays with live telemetry overlays. These tools help identify disruptions in coverage and ensure thorough analysis. [5]
How to Check Coverage Uniformity
While mapping confirms where the drone flew, checking uniformity ensures the spray quality is consistent. Telemetry charts showing speed, altitude, and flow rate can highlight areas with reduced coverage. Aim for a Coefficient of Variation (CV) of 25% or less to maintain uniformity. [8] Cross-reference spray on/off commands with speed data to quickly identify problem areas, and adjust flight speed, nozzle settings, or altitude to improve future applications.
How to Use Logs for Regulatory Compliance
Flight logs aren’t just about performance - they’re also a critical compliance tool. FAA Part 137 mandates that agricultural operators retain chemical application records for at least 2 years, and starting in 2026, the FAA will accept electronic logs as long as they are timestamped, retrievable, and backed up. [4]
Your logs should include key details like treated field GPS coordinates, application rates, chemicals used (with EPA registration numbers), weather conditions during application, and any no-spray buffer zones observed. Missing this data can lead to issues during audits or disputes over spray drift.
"If you wind up in court [regarding spray drift] and you have the data, the jury is going to be a lot more understanding. If you don't have that data, there's going to be a professional witness who's going to eat your lunch, dinner and breakfast." - Mark Ledebuhr, Principal Consultant, Application Insight [3]
Here’s a quick breakdown of required compliance fields under major U.S. frameworks:
| Regulatory Framework | Required Data Fields |
|---|---|
| FAA Part 107 | Date, time, pilot name, aircraft registration, location, mission purpose |
| FAA Part 137 | Application rate, chemical used, target field coordinates, weather conditions |
| EPA Pesticide | Product names, EPA numbers, application rates, certified applicator info |
If you're operating across state lines, it’s smart to create custom export profiles tailored to each state’s reporting templates. State-level requirements often go beyond federal standards. [7]
These practices lay the groundwork for combining flight log data with crop health metrics for even better insights.
sbb-itb-3b7eef7
How to Connect Flight Logs with Crop Health Data
By combining flight log details with crop health metrics, you can unlock valuable insights to improve your farm's efficiency and productivity.
Flight logs track essential details like flight paths, speed, and the products applied. But the true benefit emerges when you align this data with what's happening in your crops.
How to Align Spray Logs with Crop Maps
To begin, make sure all datasets - whether from drones, sensors, or other sources - use the same field names, coordinate systems, and date formats. Even minor discrepancies, like one dataset using WGS84 coordinates while another uses a local projection, can lead to mapping errors that make comparisons unreliable [4].
Once your data is standardized, tools like AcreConnect can transform logs from drones such as the DJI Agras series into "As Applied" maps. These maps detail the exact amount of product delivered at specific GPS points. Platforms like John Deere Operations Center and Climate FieldView allow you to overlay these spray records with pre- and post-spray imagery, giving you a clearer picture of application effectiveness [1][9].
"The real integration goal connects flight data to outcomes. Your spray log shows what you applied. Your yield map shows what grew. Linking these datasets reveals application effectiveness." - Kong, SkyRover Industrial Drones [4]
For nutrient-specific insights, Agroview processes multispectral drone imagery to create detailed reports on nitrogen, phosphorus, potassium, and eight micronutrients. These reports are ready within 24 hours of data collection and can be exported as Shapefiles. These files integrate directly into a drone's mission planner, enabling variable-rate applications for future passes [10].
This level of precision in mapping provides a solid foundation for analyzing crop responses.
How to Read Crop Response Patterns
Overlay your spray logs onto crop health imagery to identify areas where products were under-applied, over-applied, or applied optimally. Cross-referencing this information with speed and flow rate data can help uncover inconsistencies [4]. Additionally, reviewing environmental factors like temperature, humidity, and wind speed can clarify whether poor crop responses were due to drift, evaporation, or coverage gaps [4][6]. Understanding these factors is key to improving your next application.
How to Use Flight Logs to Improve Efficiency
Flight logs are a goldmine for identifying inefficiencies in operations. They can reveal where time, money, and fuel are being wasted. This section breaks down how to use flight log data to make smarter, more efficient decisions.
How to Evaluate Flight Performance Metrics
Flight logs offer key performance metrics that can highlight inefficiencies. Some of the most valuable ones to monitor include average flight speed (MPH), altitude consistency, battery voltages, and the spray-to-no-spray ratio. When these metrics fall outside their normal ranges, they often signal specific issues - like a pilot flying too fast through dense canopy areas or a battery nearing the end of its useful life.
Modern platforms simplify this process by flagging anomalies such as "High Speed" or "Low Battery", which reduces the need for manual reviews [11]. To make things easier, here’s a quick breakdown of the most important metrics and why they matter:
| Metric | What to Look For | Why It Matters |
|---|---|---|
| Average speed | Inconsistencies across similar fields | Impacts coverage uniformity and application rates [4] |
| Battery voltages | Uneven or faster-than-normal cell drops | Indicates aging batteries that may need replacement [5] |
| Spray time ratio | Low spray-on time compared to total flight time | Highlights inefficient maneuvering [5] |
| Altitude consistency | Deviations from target height | Affects swath width and droplet distribution [3] |
By monitoring these metrics, you can make informed adjustments to improve efficiency on future flights.
How to Use Past Logs to Plan Better Missions
Beyond monitoring performance, historical logs are a valuable tool for planning better missions. For instance, if your logs show a DJI Agras drone typically covers 12–15 acres per day with a 10-liter tank, but a similar field only yielded 9 acres, it’s worth investigating. The issue could be related to overly conservative speed settings or an altitude that was too high [3].
"Keep in mind that physics don't change because you own a drone. You hear a lot of claims about productivity and coverage... If it sounds too good to be true, it might be." - Mark Ledebuhr, Principal Consultant, Application Insight [3]
Using tools like 3D flight replays with telemetry overlays can help pinpoint inefficiencies and refine routes [11]. Combine this with spray logs and yield maps to directly link past application decisions to crop outcomes. This approach ensures your next mission is better optimized right from the start [4].
How to Use Logs to Track Maintenance Needs
Flight logs are also essential for staying ahead of equipment maintenance. By tracking total flight hours, battery cycle counts, and motor performance trends, you can schedule maintenance before equipment fails during critical operations [2][5].
Many professional logging platforms allow you to set up color-coded alerts for maintenance thresholds. For example, you’ll get a warning when a motor or spray system nears its recommended service interval [11]. Battery health is particularly important - monitoring full-charge capacity trends over time helps identify which batteries are degrading. Removing these from critical missions can prevent unexpected downtime [5].
Proactive maintenance based on flight logs plays a key role in keeping operations running smoothly and efficiently.
Conclusion: Putting Flight Log Data to Work
Flight logs aren't just about tracking where a drone has been; they provide a detailed, searchable history of every spray operation - documenting what was applied, where it was used, how much was dispensed, and the conditions during application.
These records have immediate practical value: coverage maps confirm complete field treatment, yield-linked spray logs highlight effective applications, and maintenance records ensure smooth operations - even during inspections or audits [4].
The drones offered by Drone Spray Pro - such as models from DJI Agras, XAG, and ABZ Innovation - come equipped to generate this level of detailed telemetry right out of the box. When paired with RTK dongles for sub-meter GPS accuracy and an effective log management system, these drones provide farmers with a robust data foundation to make smarter decisions season after season. Drone Spray Pro’s specialized tools create a seamless connection between operational insights and actionable farm management.
The key to unlocking these benefits lies in consistency. Record every flight, export the data in CSV or JSON formats for easy integration with farm management software, and review the logs regularly - not just when issues arise. This habit is what transforms farming from a reactive process into a truly data-driven operation.
FAQs
Which flight log format should I export (CSV, KML, JSON, or GeoTIFF)?
Export your flight logs in KML format. This format is commonly used for mapping purposes, including flight paths, field boundaries, and FAA reporting. While some systems might also provide CSV files for telemetry or application-specific data, KML is the go-to format for compliance and mapping tasks, especially with DJI and other agricultural drones supported by Drone Spray Pro.
How do I prove spray compliance using drone flight logs?
To demonstrate spray compliance, it's crucial to keep a detailed audit trail of flight operations. Modern spray drones, such as the DJI Agras series, simplify this process by automatically recording key data like flow rates, coverage patterns, and timestamps. Applications like the DJI SmartFarm app can further streamline this by syncing data to the cloud, minimizing the risk of manual errors. These logs are invaluable for meeting FAA and state reporting requirements, as they include critical details like application specifics, pilot certifications, and maintenance history.
How can I link spray logs to yield or crop health results?
To link spray logs with yield or crop health, combine your application records with harvest data. Use consistent field IDs, coordinate systems, and date formats to ensure accuracy. By overlaying spray logs with yield maps, you can analyze how effective your applications have been. Tools such as Pix4Dfields can process multispectral data, offering insights into plant health and highlighting problem areas that might benefit from targeted treatments.