Call or Text: +1 (208) 425-2990
Email: Sales@DroneSprayPro.com

Drone Weed Mapping: Survey to Spray Workflow
A weed map only matters if it turns into a spray job. I’d sum this workflow up like this: fly the field at the right time, build a georeferenced weed map, clean the detections, convert them into prescription zones, and load those zones into a spray mission that matches your drone, herbicide label, and U.S. rules.
Here’s the core idea in plain English: you’re not making maps for reporting. You’re making three outputs you can use in the field:
- Weed presence maps to show where weeds are
- Weed density maps to show how bad each patch is
- Spray prescription polygons to tell the drone where to spray and what rate to apply
A few numbers set the tone. Most survey flights work best from 10:00 a.m. to 3:00 p.m., with wind under 10–15 mph. A common mapping setup is 150 ft AGL with 80% front overlap and 70% side overlap. And if you want the spray pass to land in the right spot, RTK on both the survey drone and spray drone makes a big difference.
If I were setting this up, I’d keep the process tight:
- Fly within 24–72 hours of the spray job
- Use clean, locked exposure settings to avoid uneven imagery
- Check the orthomosaic before classifying weeds
- Remove tiny false-positive zones that the drone can’t spray well
- Ground-check a sample of weed and non-weed areas before export
- Verify file format, coordinates, and rate fields before takeoff
There’s also a compliance side. In the U.S., survey flights may fall under FAA Part 107, while spraying work generally falls under Part 137, along with state pesticide and applicator rules.
This article is about moving from survey to spray with fewer mistakes, less waste, and cleaner records.
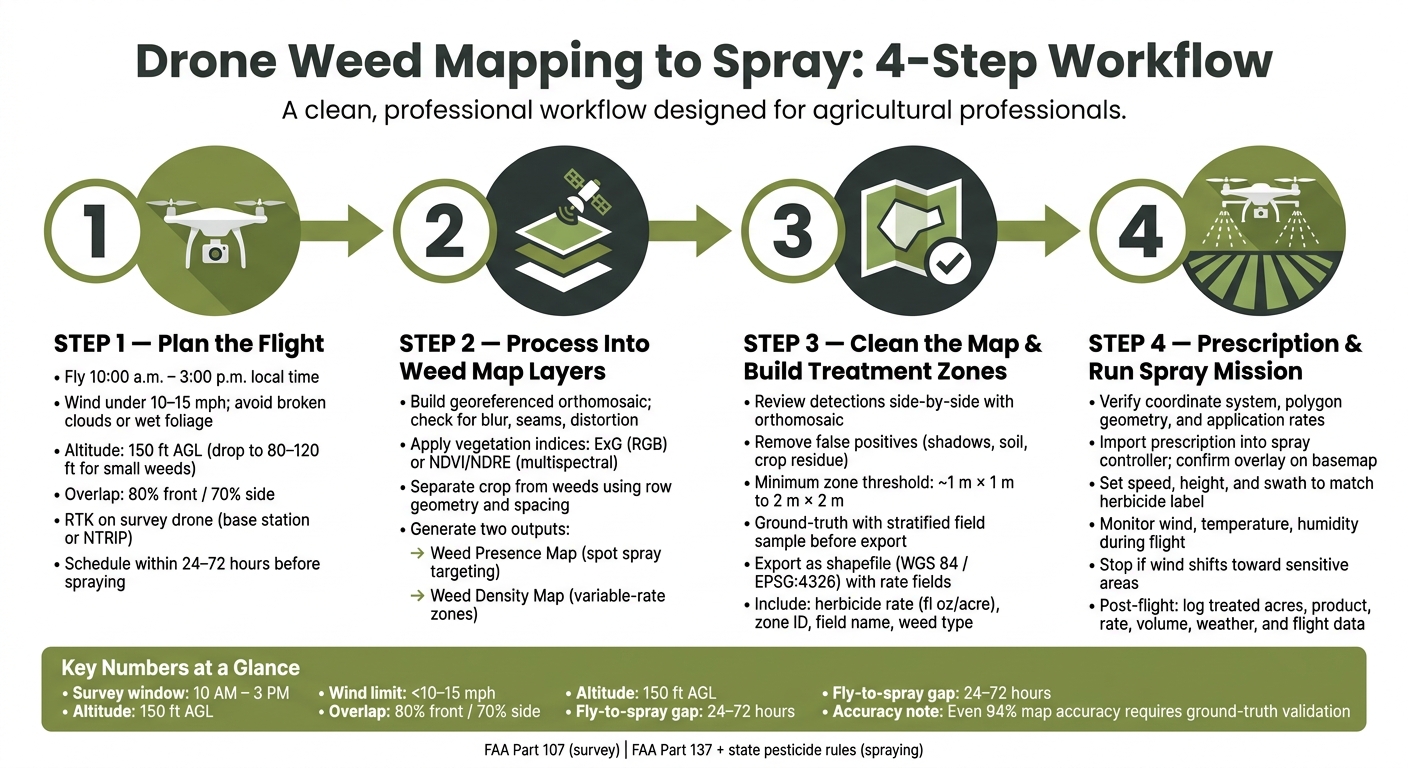
Drone Weed Mapping to Spray: 4-Step Workflow
Precision Weed Mapping with Drone Imagery and AI for Targeted Sprayer Applications | Soynomics Team

sbb-itb-3b7eef7
Step 1: Plan the Weed Survey Flight
Good weed maps start with planning. What you decide before takeoff shapes whether the imagery is usable or not. The goal is simple: get clean imagery that can turn into spray prescription zones.
Choose the Right Timing, Crop Stage, and Weather Window
The best time for a weed survey flight is mid-morning to mid-afternoon, about 10:00 a.m. to 3:00 p.m. local time[1][2][3]. That window cuts down on shadows that can hide weeds or throw off classification.
Crop stage matters just as much. Fly when weeds are easy to spot against the crop and the canopy is still open. You want weeds to show up clearly enough to become treatment zones. Go too early, and the weeds may be too small to spot with confidence. Go too late, and the canopy can cover them up. For problem species like Palmer amaranth or waterhemp, it often helps to fly shortly after a post-emergence herbicide application so you can spot the escapes that made it through.
Before you head out, check a few field conditions:
- Wind: Keep wind below 10–15 mph[1][3].
- Sky: Fly under clear skies or evenly overcast skies. Broken clouds can cause uneven lighting across the mosaic, which makes weed classification harder.
- Foliage: Skip flights right after rain or heavy dew. Wet leaves can reflect light, and wet soil can look darker than usual. Both can throw off color-based detection. Let the field dry first.
Most U.S. operators try to schedule survey flights within 24–72 hours before spraying so the weed map matches current field conditions and can move straight into a prescription.
Select Sensors, RTK, Altitude, and Overlap Settings
RGB cameras work well in most weed mapping jobs, especially when weeds stand out from the crop by color or shape. More detail now usually means cleaner weed polygons later. RGB also gives you higher resolution at a given altitude and keeps file sizes easier to handle across large fields.
Multispectral cameras add bands like near-infrared and red edge. Those bands can help separate crop and weed species when the visual differences are subtle, often through indices like NDVI and NDRE. The trade-off is pretty straightforward: multispectral sensors usually have lower megapixels per band, so you may need to fly lower to get the ground resolution you want. Some setups combine high-resolution RGB with multispectral data to improve detection.
For most U.S. row crop fields, a good starting point is 150 ft (about 46 m) AGL, with 80% front overlap and 70% side overlap[1]. That setup usually gives enough image detail to spot medium-sized weeds while still covering a fair amount of acreage per battery. If you're trying to catch small early-stage weeds or you're working in a high-value specialty crop, drop to 80–120 ft for more detail. Just be ready for more batteries and more flight time.
RTK positioning helps keep weed patches in their true spot in the field, so the spray path matches the map. Use the same RTK correction source - whether that's a local base station or a network RTK service through NTRIP - on both the survey drone and the spray drone. That keeps weed zones lined up with spray paths.
Configure Image Capture for Clean Processing
Sharp, evenly exposed images can make the processing step go smoothly - or turn it into a headache. For most RGB mapping cameras in bright daylight, start with a 1/1600 s shutter speed, ISO 100, and a mid-range aperture around f/4.5[4][5]. That setup helps limit motion blur at normal mapping speeds and avoids the image noise that comes with higher ISO settings. If it's windy, or if you're flying lower and faster, bump the shutter to 1/2000 s.
After a few test shots, switch to manual exposure and lock it for the mission. If the camera keeps changing exposure from frame to frame in auto mode, mosaic stitching gets tougher and weed classification can show variation that isn't there in the field.
Use JPEG when speed matters. Use RAW only if the lighting calls for post-flight correction.
Before you arm the drone, do a quick preflight pass. Check battery count for the planned acreage and altitude, load the field boundary, confirm airspace and mission permissions, and name the mission file by field and date - for example, NorthField_07-27-2026. That small habit can save a lot of confusion later when you're juggling multiple fields and matching maps to spray records.
With the flight done, the imagery is ready for orthomosaic and weed-layer processing.
Step 2: Process Imagery Into Weed Map Layers
Once the survey flight is done, the next job is to turn those images into georeferenced weed layers and then shape those layers into spray zones. In plain English: you take the stitched map, find the weeds, and turn that into something a prescription can use.
Build the Orthomosaic and Check Georeferencing
Import the flight images into your photogrammetry software and build the orthomosaic. Then give the mosaic a hard look. Check for missing tiles, blur, seamlines, and distortion.
When the mosaic looks clean, verify the georeferencing against a known field feature or your GCPs/RTK positions. If you flew with RTK, each image already includes centimeter-level position data, which cuts down the need for dense ground control point networks [6][7][8]. Still, it’s smart to validate the map with a few checkpoints before moving on to weed detection.
That step matters more than it may seem. If the map is off, even by a little, the spray zone moves too. And once that happens, the drone may treat the wrong area. After the alignment checks out, you can move into vegetation classification based on row position and spectral response.
Separate Crop, Soil, and Weeds
Start with vegetation indices to flag plant material. Then separate crop from weeds using row geometry, object-based analysis, or trained classification.
For RGB imagery, Excess Green (ExG) is a solid starting point. If you’re using a multispectral sensor, NDVI and NDRE can help separate plants more clearly, especially when crop and weed signatures look similar in standard imagery.
The key idea is simple: indices tell you where vegetation is, but they don’t tell you what it is. That’s where row logic or classification comes in. Use row position, planting direction, and spacing to sort crop from weed.
You don’t need perfect species-level labeling here. What you need is weed zoning you can trust. From those detections, build weed presence and weed density layers for treatment planning.
Generate Weed Presence and Density Maps
At this stage, you’ll create two layers: weed presence and weed density.
The presence layer is useful for spot spraying. It shows where weed patches exist so clean areas can stay untouched. The density layer supports variable-rate treatment. These are the layers the spray drone uses to skip clean ground and focus on problem areas.
For the density map, aggregate detections into a grid. The grid size should match the spray swath and the rate resolution you want. Go too fine and you add noise. Go too coarse and you end up treating more area than needed.
Set density thresholds based on spray rate, not just how the map looks. A low-density zone may mean scattered weeds that call for a reduced rate. A high-density zone points to thicker patches that need a full-rate pass.
Those layers then move into the noise-cleanup and ground-truth step before export.
Step 3: Clean the Map and Build Treatment Zones
Raw weed detections don't become sprayable on their own. They need cleanup and a field check first.
At this stage, your job is simple: turn weed presence and density layers into spray-ready treatment zones. That's harder than it sounds. Raw detections often pick up shadows, wheel tracks, crop residue, or low-confidence pixels. If you leave those in, you end up spraying clean ground.
Remove Noise and Fix Misclassification
Open the classification layer next to the orthomosaic and review them side by side. Zoom all the way in on suspect polygons, with field boundaries and row direction visible. That extra context helps a lot.
If a polygon sits on bare soil or runs over a crop row, it's probably a false positive. Treat the orthomosaic as your source of truth. If the image doesn't show weed canopy, that polygon shouldn't stay in the cleanup layer.
Then set a minimum treatment threshold based on the drone's effective spray width. For many heavy-lift spray drones, a zone around 1 m × 1 m to 2 m × 2 m is a practical starting point. But don't treat that as a fixed rule. The real cutoff should match how well the drone can switch spray on and off in the field.
From there:
- Delete or merge polygons below that threshold
- Dissolve adjacent polygons of the same class
- Smooth jagged edges so zones are easier to spray
This part may feel tedious, but it saves spray, cuts clutter, and makes the map far easier to use in the field.
Ground-Truth the Map Before Spraying
Don't skip the field check before exporting zones. Even 94% accuracy still leaves enough mistakes to affect herbicide use and crop safety[9].
You don't need to walk every acre. A stratified sample is enough. Check a few high-density detections, a few sparse ones, and several areas the map marked as clean. Walk short transects through each area and record what you find on the ground.
That gives you a fast reality check:
- If you keep finding clean ground inside weed polygons, raise the detection threshold
- If you find weeds where the map showed none, adjust the classification before building prescriptions
GPS-enabled mobile forms can make this much easier. They keep each checkpoint tied to its coordinates, which helps when you compare results across later flights.
Export Spray-Ready Prescription Zones
Once the map has been checked and cleaned, convert the weed layer into treatment zones. Each polygon should include the details the operator needs during flight:
- Herbicide rate in fl oz/acre
- Zone ID
- Field name
- Weed type, if known
- A review note for uncertain areas
Those attributes matter more than many teams expect. Files often pass through planning tools, flight controllers, and multiple people. If the data isn't clear, mistakes creep in fast.
Match the zone setup to the weed pattern and the kind of spray control you're using:
| Factor | Spot Spraying | Variable-Rate Zone Spraying |
|---|---|---|
| Map detail | High, at individual patch level | Moderate, at management zone level |
| Zone size | Small, localized polygons | Larger grouped zones |
| Savings | High - skips clean ground | Moderate - reduces rate in lower-pressure areas |
| Cleanup effort | Higher - more cleanup and more polygons | Lower - fewer, simpler zones |
| Spray drone compatibility | Best for scattered, distinct patches | Better for continuous or widespread pressure |
Use spot spraying for scattered escapes. Use variable-rate zone spraying when weed pressure is broader and more continuous.
Export the final prescription as a shapefile for broad GIS compatibility, or use the controller-ready format built into your spray workflow. Before you transfer the file, check that the coordinate reference system, geometry, and rate attributes are still intact. Once those checks are done, the file is ready to load into the spray mission.
Step 4: Load the Prescription and Run the Spray Mission
Once you’ve exported clean treatment zones, the final part is simple in theory: load them into the spray controller and fly the job. In practice, this is the point where small setup mistakes can throw the whole mission off, so it pays to slow down and check the file before takeoff.
Prepare Files for Agricultural Spray Drones
Export the prescription in a controller-compatible format, and use a short, clear file name so the controller reads it without issues. Before you load anything, make three fast checks:
- Coordinate system
- Polygon geometry
- Application rates
Export in WGS 84 (EPSG:4326). If the coordinate system is off, treatment zones can land in the wrong place. That’s a headache you do not want in the field.
It also helps to simplify polygons and merge very small zones into nearby areas. If you leave too many tiny shapes in the file, you end up with extra waypoints and a messy mission path.
Import the file through the controller’s prescription map or variable-rate menu. Then check the overlay against a basemap before takeoff. If the prescription lines up where it should, you’re ready to move from file checks to field spraying.
Execute the Spray Mission and Record Results
Set speed, height, swath, and rate to match both the herbicide label and the prescription. The drone should follow the same treatment zones built from the weed map, not some rough version of them.
Calculate ground speed from nozzle output and target GPA. Don’t wing it. A bad speed setting can throw off the whole application rate.
Use the manufacturer-recommended height above the canopy to get even coverage and cut down drift. Then keep an eye on field conditions during the mission. Watch:
- Wind speed and direction
- Temperature
- Humidity
If the wind shifts toward sensitive areas like waterways, organic fields, or neighboring crops, stop right away. It’s better to pause than to deal with drift damage later.
During flight, use live speed, height, and flow changes as needed to deal with dense weed patches without rebuilding the full mission. That gives you some flexibility while still staying inside the planned treatment zones.
After the mission, record treated acres, zones flown, product, rate, volume, equipment, and weather. Export the flight log and store it with the spray records. Keep pesticide records for the retention period your state requires. Store those logs with the weed maps too, so you can compare pre- and post-spray results and put a number on savings.
Conclusion: A Repeatable Survey-to-Spray Workflow
This workflow comes down to six steps done the same way each time: fly when weeds are visible, capture well-georeferenced imagery, process and validate weed layers, remove map noise, convert the results into clean treatment zones, and load those zones into a spray mission that matches the herbicide label and equipment specs.
Each step affects the next. Sloppy survey timing leads to weak maps. Weak maps lead to bad prescriptions. Bad prescriptions waste chemical and miss weeds.
When the process is tight, you spray only the infested areas, cut herbicide use, and build records you can use to improve detection accuracy and treatment efficiency from season to season. Drone Spray Pro offers spray drone packages, training, FAA licensing support, and RTK accessories to standardize the workflow.
FAQs
How accurate must a weed map be before spraying?
For effective drone spraying, accuracy matters a lot. Standard GPS usually isn't enough because it often only gets you within 1.5 to 3 meters.
If you want row-level alignment and less chemical overlap, go with RTK-enabled systems. RTK can improve positioning to about 1 centimeter, which helps prescription maps line up with actual field conditions and hit problem areas with far more precision.
When should I choose spot spraying over variable-rate zones?
Choose spot spraying when weeds show up in patchy or uneven patterns and you need to hit small, specific parts of the field. It treats only the weeds you identify, which helps cut chemical waste and lowers risk to crop safety.
Use variable-rate zones instead when you’re dealing with field-wide variation, like differences in nutrient levels or soil moisture.
What file checks matter most before loading a spray prescription?
Before you load a spray prescription, check that the shapefile uses WGS84 (EPSG:4326). The attribute table also needs these fields: rate, rateInt, unit, and zone.
For KML files, make sure every coordinate includes altitude data.
A few other checks matter too:
- Keep polygons simple
- Avoid nested areas
- Don’t use too many vertices
- Keep files under 200 MB
- Make sure your controller supports the file format and unit types
Miss one of those details, and the file may not load the way you expect.
