Call or Text: +1 (208) 425-2990
Email: Sales@DroneSprayPro.com

Crop Stress vs Disease: UAV Data Signals
From a drone, crop stress and crop disease can look almost the same. I’d treat UAV maps as a way to narrow the cause, not confirm it. The short version: stress often follows field setup, while disease often starts in patches and spreads. Thermal, RGB, and multispectral layers help, but ground checks still decide the call.
If I wanted the fastest read, I’d look for these signs first:
- Broad, even fading across a zone often points to water, nutrient, or soil problems.
- Patchy spots, lesions, or irregular clusters often point to disease or pests.
- Straight lines, pivot arcs, wheel tracks, or soil boundaries lean toward abiotic stress.
- Hot patches that expand over time lean toward disease.
- Repeat flights matter because fixed field problems tend to stay in place, while disease can spread.
- Timing matters: midday thermal flights usually show the clearest canopy heat contrast, and flights right after rain or irrigation can mislead you.
- Late-season maps get harder to read because natural yellowing can hide disease signals.
- Field scouting is still the final step before any spray or irrigation fix.
A few numbers help frame this. In one study, some vegetation indices had a -0.51 to -0.71 correlation with disease severity. And early blight in potatoes can lead to 20% to 50% yield loss in some cases. So the stakes are clear: if I misread the signal, I can waste time, miss the problem, or make the wrong treatment call.
IoT4Ag Voices: Efficient Detection of Crop Disease Risk

sbb-itb-3b7eef7
Quick Comparison
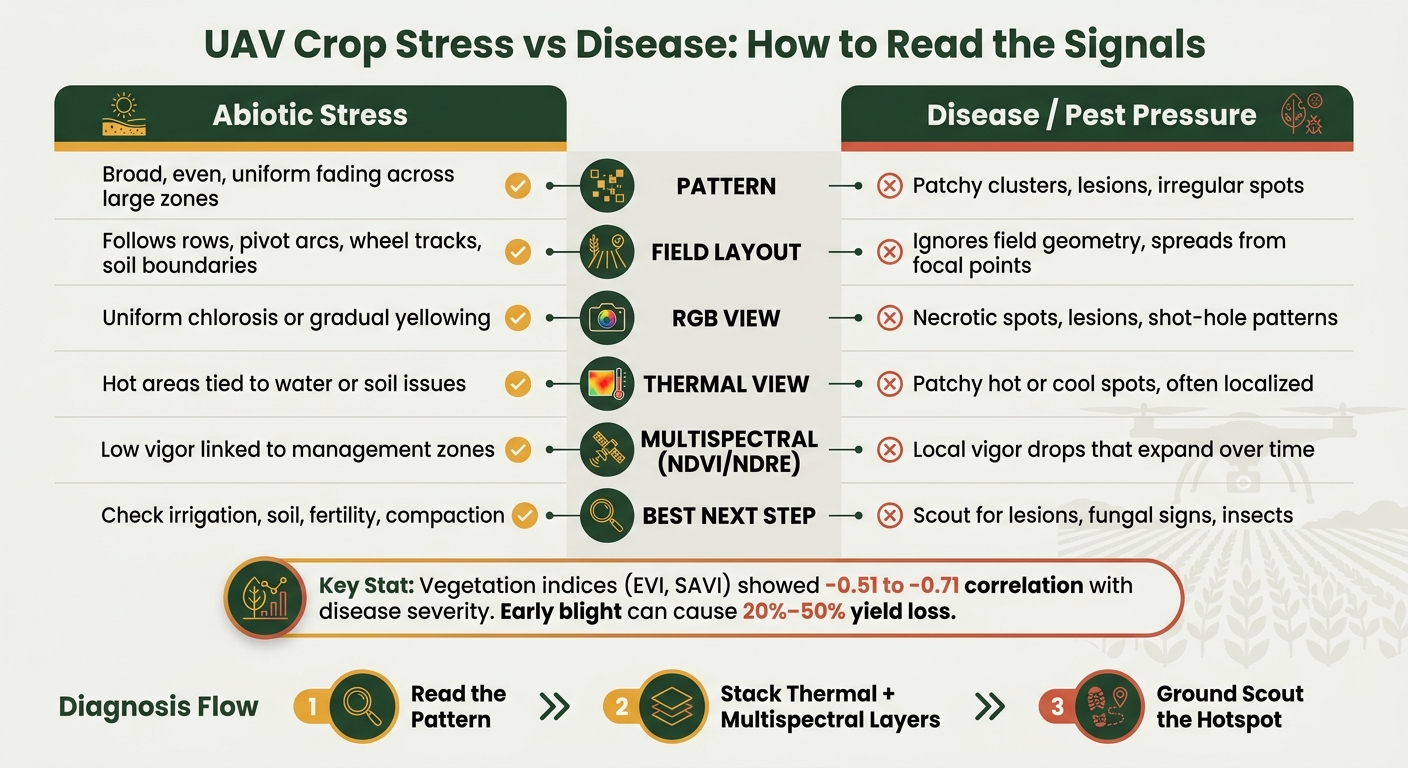
UAV Crop Stress vs Disease: How to Read the Signals
| Check | Abiotic Stress | Disease |
|---|---|---|
| Pattern | Even, broad, or tied to field zones | Patchy, clustered, spreads from a point |
| Field layout | Follows rows, pivots, tracks, topography | Often ignores field geometry |
| RGB view | Uniform yellowing or thinning | Lesions, dead spots, uneven damage |
| Thermal view | Hot areas often tied to water or soil issues | Hot or cool patches, often local |
| Multispectral view | Low vigor linked to management zones | Local vigor drops that can spread |
| Best next step | Check irrigation, soil, fertility, compaction | Scout for lesions, fungal signs, insects |
My takeaway: I’d read the pattern first, then compare heat and vigor layers, then walk the hotspot with GPS points and field records in hand.
Visual and spatial signals: how stress patterns differ from disease patterns
Color and heat can overlap. So the fastest way to tell stress from disease is often the pattern itself.
Before you check any index, look at where the issue shows up and what shape it takes. Is it spread evenly across a zone? Or does it pop up in small pockets? That first read can tell you a lot. If the pattern still feels murky, thermal and multispectral layers help narrow it down.
Canopy color shifts and lesion patterns
Abiotic stress usually spreads in a more even way. Water stress, nutrient shortages, and other field-wide issues often show up as broad, uniform paling or chlorosis across large areas. In many cases, they also follow a simple gradient tied to management or soil conditions [1].
Disease tends to look more local. Fungal and bacterial infections often create small clusters or patches with lesions, necrotic spots, and uneven discoloration that stand out against healthy tissue [1][3].
| Signal | Abiotic Stress | Disease or Pest Damage |
|---|---|---|
| Color change | Uniform chlorosis, uniform fading | Patchy lesions, necrotic spots, "shot-hole" patterns |
| Pattern shape | Gradual or field-wide | Point-like, clustered or irregular |
| Canopy texture | Even stress across zones | Mixed healthy and damaged tissue |
| Distribution | Follows soil, irrigation, or environmental gradients | Spreads from infection centers outward |
That difference matters. A field with a smooth fade across a large section points you toward water, fertility, or soil issues. A field with scattered blotches or dead spots pushes you toward disease or pest pressure.
Field layout clues from rows, pivots, and topography
Field layout gives you another strong clue.
If the damage follows a geometric pattern - straight rows, pivot arcs, wheel tracks, or soil type boundaries - abiotic stress is more likely. Compaction can show up along equipment paths. Drought stress often appears in bands where sandy ridges dry out faster. Fertility or irrigation shifts can also line up with soil boundaries or management zones [1].
Disease usually doesn't stay inside those lines. It often spreads from an infection center, such as a wet low area or a field edge with more infected residue [1][5]. Low spots and humid areas are common starting points for pathogens like Alternaria solani, which causes early blight in potatoes and can lead to yield losses of 20% to 50% [5].
So if the map tracks rows, pivots, or topography, think abiotic first. If the damage spreads outward from one or two focal points, that's a strong sign to check for a biotic cause.
Start with the full orthomosaic, then zoom in. If the map still looks mixed, move next to heat and index layers.
Thermal and multispectral layers: where signals overlap and where they split
After color and pattern, thermal and multispectral layers help you figure out whether you're looking at a plant process or a field setup issue. They narrow the field. They don't make the final call on their own.
Heat patterns from water stress, heat stress, and disease
Water-stressed plants usually run hotter because they close their stomata to hold onto moisture. Once stomata close, transpiration drops and canopy temperature goes up [1].
Disease can shift canopy temperature too. That may show up as hot patches or cool patches, depending on the kind of tissue damage involved [1][2].
This is where timing can make or break the read. Sun angle, cloud cover, humidity, and any recent irrigation or rain can change what the thermal sensor sees [1]. For the clearest contrast between stressed and healthy plants, fly during peak solar radiation, which is usually around midday [1]. Skip flights right after irrigation or a rain event. Wet soil and moisture on the canopy can distort the thermal signal [1].
If the thermal layer doesn't give you a clean answer, check the multispectral layer and see whether vigor loss lines up with the hot spots.
What NDVI, NDRE, and related indices can flag
NDVI and NDRE can flag declining vigor, but they can't tell you the cause by themselves. In dense mid- to late-season canopies, NDRE tends to stay more useful because NDVI starts to saturate [3].
One faba bean study found that indices such as EVI and SAVI had a strong negative correlation with disease severity, from -0.51 to -0.71 [4].
How stacking data layers builds confidence in a diagnosis
The real value shows up when you compare layers side by side.
| Stress Type | Signal Summary |
|---|---|
| Water Stress | Hot; low vigor; tied to soil or irrigation zones |
| Heat Stress | Uniform heat; indices may stay near normal early |
| Nutrient Stress | Variable heat; low chlorophyll; follows management zones |
| Disease Pressure | Patchy heat; localized index drops; expands over time |
When a hot spot on the thermal map matches a low-vigor zone on NDRE and a visible symptom patch on the RGB map, that overlap gives you much more confidence. It’s the difference between a hunch and a pattern you can defend. If the thermal and multispectral maps don't match, slow down and look closer before making a treatment call. This is especially critical when deploying agricultural spray drones for targeted applications.
Repeat flights help too. Disease pressure tends to spread, so the affected area grows and shifts from one flight to the next. Abiotic stress tied to soil type or topography usually stays put [1]. That change over time is one of the clearest ways to separate a spreading pathogen from a fixed field problem. If the layers still point in different directions, move to ground scouting before treating.
Timing and scouting workflow: common mix-ups during drone checks
Once pattern and layer overlap narrow things down, crop stage and field history usually decide the call.
Early-season vs late-season signals
Crop stage changes what your maps can and can’t tell you.
Early in the season, multispectral and thermal sensors can spot physiological stress before RGB imagery shows any visible color shift [1][2]. That matters because the crop can look fine from a normal photo while stress is already building.
Late in the season, things get messier. Senescence can mask disease signals and make UAV classification less dependable. If you’re flying late-season, take the maps as a clue, not proof, and put more weight on field checks.
Common false calls during drone scouting
Start with shape. Disease and pest pressure usually show up as irregular patches. Management problems are more likely to follow rows, arcs, edges, or traffic lines.
Here are the false positives worth ruling out first:
| Scouting Mix-up | Misleading UAV Cue | Field Check Needed |
|---|---|---|
| Irrigation failure | High thermal signature or low NDVI in circular or linear patterns | Check soil moisture and nozzle function at the hotspot |
| Herbicide drift | Uniform chlorosis or stunting along field edges or in the direction of prevailing wind | Inspect leaf shape for twisting or cupping; review spray records |
| Poor stand establishment | Patchy low NDVI or thin canopy cover early in the season | Check seeding depth, soil crusting, or seedling pest damage |
| Senescence | Broad NDVI drop and increased visible red reflectance late in the season | Compare with crop maturity dates; look for lesions vs. natural yellowing |
| Mechanical damage | Linear hotspots or low-vegetation tracks across the field | Check for wheel tracks, equipment passes, or recent field work |
A few patterns tend to repeat. Circular low-NDVI zones often point to irrigation trouble. Sharp-edged yellow strips along field borders are more likely herbicide drift than disease. Linear areas of low vegetation often trace back to wheel traffic or equipment passes.
A ground-first verification workflow
When imagery is unclear, timing and ground truth make the difference between plain stress and actual disease. Use this workflow to move from map anomaly to field confirmation:
- Baseline flight: Fly a multispectral or thermal mission, build an orthomosaic, and flag anomalies.
- GPS marking: Pin the centroids of suspected stress or disease patches in your flight software.
- Ground inspection: Walk to marked locations and check for lesions, fungal structures, insects, soil moisture, or physical damage.
- Record comparison: Cross-check what you find against irrigation logs, spray records, and fertilizer application dates to rule out management problems.
- Decision: Decide whether the issue needs targeted drone spraying, an irrigation fix, or simple monitoring.
Verified hotspots help guide targeted treatment and cut wasted input.
Conclusion: using UAV signals to make better treatment decisions
After comparing pattern, heat, and canopy signals, the main move is to read the layers together before making a treatment call. Use UAV layers as a set: thermal for water stress, multispectral for vigor loss, and RGB for visible symptoms. That combined view matters because it shows where scouting on the ground will pay off most.
UAV scouting should help narrow three things: the cause, the location, and the priority for field checks. In plain terms, it helps show which acres need attention first.
Key takeaways for growers and drone operators
The takeaway is simple: use UAV data to narrow the problem, then confirm it on foot. Stress usually follows field patterns, while disease usually spreads in patches. Thermal and multispectral maps can point you toward the cause, but repeated flights and field checks are still what make the final call.
FAQs
How many UAV flights do I need to confirm spread?
Don’t lean on just one flight to confirm crop stress or disease spread. Instead, compare thermal or multispectral hotspots against a healthy reference area in the same field.
Then fly the same area again over time. If the anomaly keeps showing up, gets worse, or stays about the same, you’ve got a much clearer read on what’s happening. That makes it easier to tell the difference between short-term field noise and an issue that’s actually spreading.
Which UAV layer should I trust first?
Start with the thermal layer. It can show early water stress before wilting or yellowing shows up, which gives you your first warning sign.
Then use RGB to look for visible damage patterns like yellowing, lesions, and stand gaps. If you want the clearest view of field zones, check both together - but begin with thermal.
When should I scout a hotspot on foot?
Scout a flagged hotspot on foot within 24 to 48 hours after your thermal UAV flight. Use the map coordinates to head straight to the area.
Then inspect the leaves, stems, roots, and soil moisture. Also check irrigation hardware.
