Call or Text: +1 (208) 425-2990
Email: Sales@DroneSprayPro.com

Crop Stress Detection with Thermal and RGB Data
If you want the earliest warning, use thermal. If you want visible proof, use RGB. If you want the clearest field check, use both.
I’d sum it up this way: thermal data spots heat stress in the canopy before wilting or yellowing starts, while RGB imagery shows the visible damage once it appears. In the article, the main pattern is simple: thermal is best for early water stress, RGB is best for visible crop issues, and stacking both layers helps turn hot spots into scoutable treatment zones.
Here’s the short version:
- Thermal data measures canopy temperature and can flag water stress at the pre-visual stage.
- RGB imagery shows color change, leaf damage, stand gaps, and canopy shape once symptoms are visible.
- Water stress often shows up in thermal first because stomata close and the crop heats up.
- Nutrient, pest, and disease issues often become easier to verify in RGB later.
- Layered thermal + RGB maps help remove soil noise and improve scouting.
- One cited method reached R² = 0.94 and RMSE = 0.7°C when RGB masking was used with thermal data.
- In one lettuce example, imaging found water stress up to 84 hours earlier than soil moisture sensors.
- Flight setup matters: 11:00 AM to 1:00 PM, clear skies, stable weather, 85% to 90% overlap, and steady altitude.
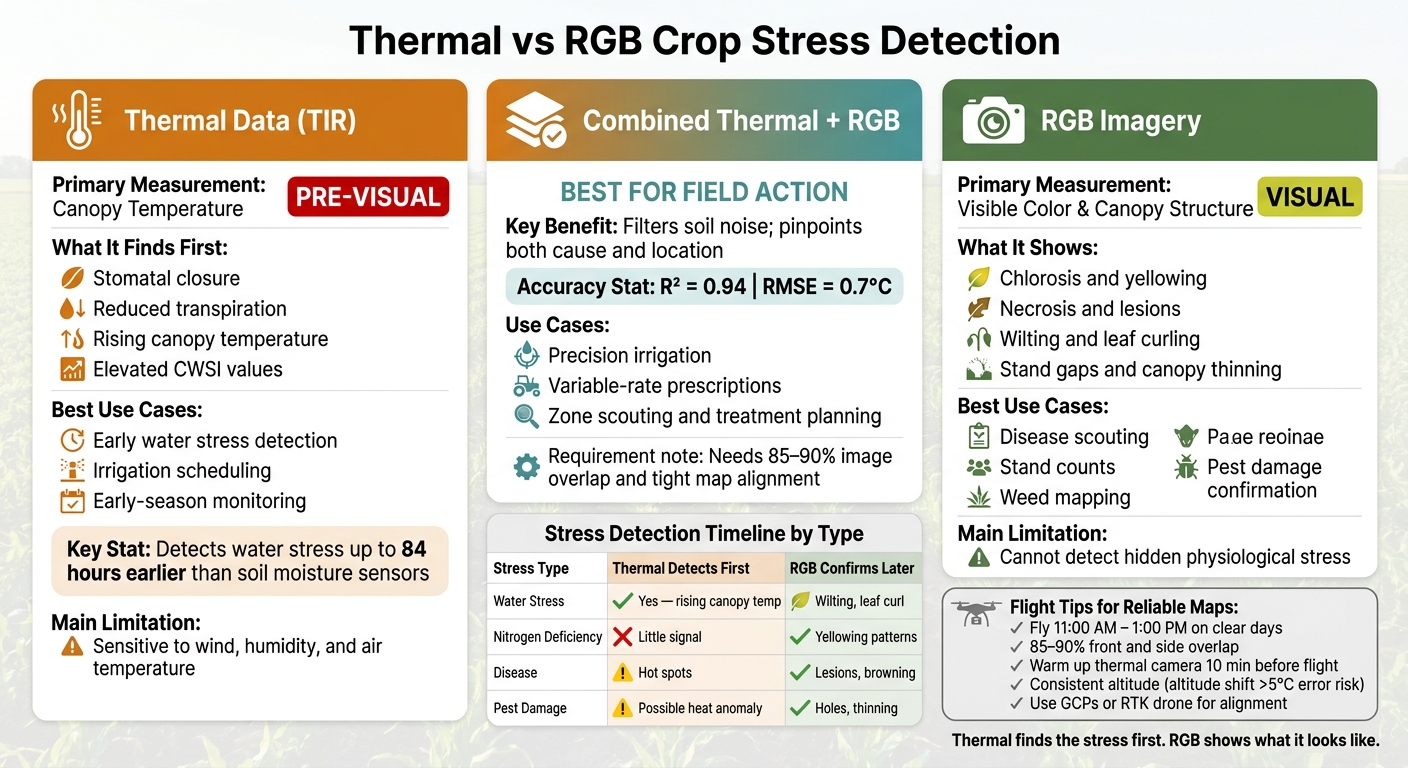
Thermal vs RGB Crop Stress Detection: What Each Sensor Finds First
Drones, Thermal & Multispectral Cameras for Water Stress & Precision Irrigation - AI in Agriculture
sbb-itb-3b7eef7
Quick Comparison
| Data Layer | What it Measures | What It Finds First | Best Use | Main Limit |
|---|---|---|---|---|
| Thermal | Canopy temperature | Water stress, reduced transpiration | Irrigation checks, early stress mapping | Readings shift with wind, humidity, and altitude |
| RGB | Visible color and canopy structure | Yellowing, lesions, wilting, stand gaps | Disease scouting, stand counts, weed checks | Can’t detect hidden heat stress |
| Thermal + RGB | Heat + visible crop condition | Early stress plus visual confirmation | Zone scouting and treatment planning | Needs tight map alignment and added processing |
Bottom line: I’d use thermal to find where stress starts, RGB to see what it looks like, and both together when I need a field map I can act on.
Thermal Data vs RGB Imagery: What Each One Detects
Thermal data: canopy temperature, transpiration, and early stress signals
Thermal and RGB don’t pick up stress at the same point in time. Thermal data shows earlier plant stress signals, while RGB usually shows damage after it becomes visible.
Thermal data tracks canopy temperature. A healthy plant cools itself through transpiration. Once water stress starts, stomata close to hold onto moisture, transpiration drops, and canopy temperature goes up. That’s why thermal data can flag stress before you can see it in the field [1].
Agronomists often read those temperature shifts with the Crop Water Stress Index (CWSI), which compares canopy temperature against wet and dry reference baselines [1][2]. DANS takes a similar approach by comparing canopy temperature with a healthy reference plant [2]. That said, thermal readings can shift with wind, humidity, and air temperature, so steady flight conditions and calibration are a big deal [1].
RGB imagery: color, canopy structure, and visible damage
RGB sensors record visible color and canopy structure. That makes them useful for spotting problems such as chlorosis, necrosis, wilting, leaf curling, lodging, stand gaps, and pest or disease pressure once those signs show up.
RGB data can also support simple vegetation indices. On top of that, RGB can help build FVC masks so bare soil doesn’t skew thermal maps. But RGB has a clear limit: it can’t measure canopy temperature and can’t spot stress before visible symptoms appear.
Comparison table: thermal data vs RGB imagery for crop stress detection
| Feature | Thermal Data (TIR) | RGB Imagery |
|---|---|---|
| Primary Measurement | Canopy temperature | Visible color and structure |
| Earliest Stress Sign | Stomatal closure and reduced transpiration | Chlorosis, necrosis, wilting, and stand gaps |
| Detection Timing | Pre-visual | Visual |
| Best Use Case | Early water stress and irrigation scheduling | Disease scouting, stand counts, and weed mapping |
| Main Limitation | Sensitive to wind, humidity, and air temperature | Cannot detect hidden physiological stress |
That timing gap matters. If you want the first warning that a crop is struggling, thermal usually gives it to you first. If you want to confirm what the crop looks like and map visible damage, RGB is often the better layer to check next.
The next question is which stress types show up first in each layer.
Which Stress Signs Show Up Earlier
Not all stress shows up at the same moment across both image layers.
Water stress usually appears first in thermal maps
Water stress often starts with a heat signal. Stomata close, transpiration drops, and canopy temperature goes up before you see wilting or color shift.
In lettuce, thermal and RGB imaging detected water stress up to 84 hours earlier than soil moisture sensors [4]. As Max Gerhards, Luxembourg Institute of Science and Technology, put it:
"Since stomatal closure is one of the first responses to water stress, plant temperature as measured by TIR sensors can be used to detect water stress pre-visually." - Max Gerhards, Luxembourg Institute of Science and Technology [1]
That makes thermal the first place to look when irrigation may be off, especially when using agricultural spray drones in Idaho to monitor field health.
Nutrient, disease, and pest symptoms often become clearer in RGB later
Other stress types usually become easier to spot in RGB later on.
Thermal is not very strong for nutrient stress. RGB does a better job once yellowing and canopy thinning start to show. If thermal indices like Crop Water Stress Index (CWSI) go up while RGB imagery still looks green and even, the crop may already be dealing with early water stress [5].
Disease and pest pressure often follow the same pattern. Thermal can point to hot spots, but RGB helps verify the cause with lesions, browning, holes, or thinning [1].
Comparison table: early detection timing by stress type
| Stress Type | What Thermal May Show First | What RGB Shows Later | Practical Scouting Value |
|---|---|---|---|
| Water Stress | Rising canopy temperature, elevated CWSI values | Leaf curling, wilting, canopy thinning | High - helps trigger irrigation checks early |
| Nitrogen Deficiency | Often little or no clear change | Yellowing patterns, lower canopy density | High - helps confirm nutrient scouting needs |
| Disease | Localized hot spots from tissue damage | Lesions, browning, dead zones | Moderate - thermal flags location, RGB confirms cause |
| Pest Damage | Possible heat anomalies from canopy loss | Holes, thinning, visible feeding damage | Moderate - RGB provides clearer confirmation |
Thermal gives you the first warning. RGB shows what that warning looks like in the field. Used together, they turn stress maps into scouting zones you can act on.
Layering Thermal and RGB Data for Better Field Decisions
How layered sensor data improves scouting, diagnosis, and treatment zones
Thermal data shows where stress is building. RGB helps explain why. But that only works if both layers line up pixel for pixel.
Once the thermal and RGB maps are aligned, the RGB layer can mask soil, shadows, and crop residue so canopy temperature readings stay clean. In one combined RGB-thermal masking method, extracted canopy temperatures matched ground-truth measurements with an R² of 0.94 and an RMSE of 0.7°C [2]. That’s a big deal in the field. Instead of flipping between two separate images, you get one map you can actually scout from.
Here’s what that looks like in practice: a hot patch shows up in the thermal layer, then the RGB view helps you check whether it’s early stress with no visible symptoms yet or damage you can already see. That cuts down guesswork and helps crews move faster.
U.S. farm uses: irrigation checks, disease scouting, and targeted spraying
This kind of layered workflow is already shaping irrigation calls in U.S. fields. In the Mississippi Delta, layered maps have flagged irrigation failures. In Missouri, they’ve picked up stressed strips before visible damage spread [6].
"By the time leaves droop, stalks curl, or wilting become visible, the crop has already been under stress for several days. That lost time often translates into lost yield." - Harmeet Singh-Bakala et al., University of Missouri [6]
That timing matters. If thermal narrows the problem area early, RGB can help confirm whether the issue points to disease, nutrient limits, pests, or irrigation trouble. The end result isn’t just a picture of the field. It’s a treatment zone you can act on. High-capacity systems like the ABZ Innovation L30 allow for rapid response once these zones are identified.
Comparison table: thermal only vs RGB only vs combined layers
| Workflow | Main Strength | Main Weakness | Best Fit in Scouting | Likely Field Follow-up |
|---|---|---|---|---|
| Thermal Only | Detects elevated canopy temperature days before visible symptoms [6] | Sensitive to soil background and weather conditions [6][2] | Early-season irrigation monitoring | Check pivot pressure, soil moisture levels |
| RGB Only | High resolution; shows visible damage and canopy structure [3] | Symptoms appear only after yield potential is already lost [6] | Late-season disease scouting, stand counts | Identify specific pest or nutrient deficiency |
| Combined Layers | Filters soil noise; pinpoints cause and location [2][4] | Requires more complex data processing and map alignment [2][4] | Precision irrigation and variable-rate prescriptions | targeted spraying or zone-specific irrigation fix |
The next step is getting flight timing and calibration right so the maps stay trustworthy.
Flight Conditions, Data Processing, and Key Takeaways
Flight timing, calibration, and map processing basics
Once you know what each layer shows, flight timing and processing are what make the map dependable.
Fly thermal and RGB missions between 11:00 AM and 1:00 PM on clear days. Solar noon cuts RGB shadows and improves thermal contrast.
Weather matters more than it might seem at first glance. Wind can cool the canopy and hide thermal stress. Cloud cover can create uneven light that throws off RGB vegetation indices. High humidity can also interfere with thermal readings [2][6].
Before takeoff, power on the thermal camera 10 minutes early so it can stabilize. Enter the current air temperature and humidity, then capture a handheld infrared reference before and after the mission [2][7].
Keep flight height consistent. If altitude changes too much, thermal maps can read more than 9°F (5°C) cooler [2]. For processing, convert thermal files from radiometric JPEG to radiometric TIFF before building the orthomosaic. That keeps the temperature value in each pixel intact [7].
For cleaner map alignment:
- Use 85% to 90% front and side overlap
- Use Ground Control Points (GCPs) or an RTK-enabled drone
- Make sure thermal and RGB layers line up correctly when stacked [2]
Clean flights and well-aligned layers turn raw images into scouting decisions.
When to use thermal, when to use RGB, and why both matter
After capture and alignment, the choice between thermal and RGB comes down to one thing: do you need early warning or visual proof?
Thermal is the early alert. It can flag stress before the crop shows clear visible symptoms.
RGB is the follow-up. Once thermal marks a zone, RGB helps show what’s behind the anomaly, including disease lesions, pest damage, chlorosis, stand gaps, and canopy structure changes [3][6].
That’s why the two layers work so well together. Thermal tells you where to look first. RGB helps explain what you’re looking at.
Use thermal for early irrigation checks, RGB for visible damage, and both for precise zone mapping.
Thermal finds the stress first; RGB shows what it looks like.
FAQs
How accurate is thermal stress detection in real field conditions?
Thermal stress detection can pick up very small shifts in plant temperature, often before you can see any damage with the naked eye. That makes it useful for spotting trouble early.
That said, field accuracy isn't just about water status. Canopy temperature also changes with air temperature, wind, and humidity. In other words, a hot plant isn't always a thirsty plant. Those outside conditions can push readings up or down, which is why context matters.
Pairing thermal data with RGB imagery helps clean this up. RGB images make it easier to separate plant canopies from the soil, which cuts down on background noise and soil interference. When you use both layers together, monitoring gets more dependable and irrigation decisions can be made with better precision.
Can thermal imaging tell water stress from disease or nutrient issues?
Thermal imaging works well for spotting water stress because it picks up rising canopy temperature. That heat increase usually happens when stomata close and transpiration drops.
The catch? Water stress isn't the only thing that can cause that pattern. Nutrient shortages and plant diseases can also make crops look warmer in thermal images.
That's why it helps to pair thermal data with RGB imagery. Thermal shows where the plant is under stress, while RGB adds visible clues like leaf color and plant structure. Put the two together, and it's much easier to tell water stress apart from other plant health problems.
What drone setup is needed to capture usable thermal and RGB maps?
You need a UAV with a multisensor setup that includes a thermal infrared camera and a high-resolution RGB camera. Used together, these sensors map canopy temperature and surface greenness.
Good results also depend on consistent flight paths and proper calibration. That way, the thermal and RGB images line up correctly and can be processed into field maps.