Call or Text: +1 (208) 425-2990
Email: Sales@DroneSprayPro.com

How to Combine Satellite and Drone Data for Field Zoning
Combining satellite and drone data can help farmers optimize field zoning, saving resources and improving crop management. Satellites provide broad, seasonal trends, while drones offer detailed, real-time insights. Together, they create precise management zones for tasks like variable-rate fertilization and irrigation.
Key Steps:
- Set Goals: Define what you want to achieve (e.g., nitrogen application, water stress detection).
- Choose Data Sources: Use satellites for long-term patterns and drones for high-resolution details.
- Select Sensors: Match sensors to goals (e.g., NDVI for vigor, thermal for water stress).
- Collect Data: Align satellite and drone data by timing and location.
- Process & Analyze: Merge datasets, create zones using clustering methods, and validate with field checks.
- Apply Zones: Export maps for equipment like spray drones and adjust applications based on zones.
Benefits:
- Reduce nitrogen use by up to 28 lbs/acre.
- Cut irrigation costs by 20–25%.
- Maintain crop yields while lowering input costs.
Quick Tip: Use tools like PIX4Dfields for offline processing and RTK-enabled drones for precise mapping. Align data formats and coordinate systems to ensure accuracy.
This guide simplifies integrating satellite and drone data, helping farmers make smarter decisions for their fields.
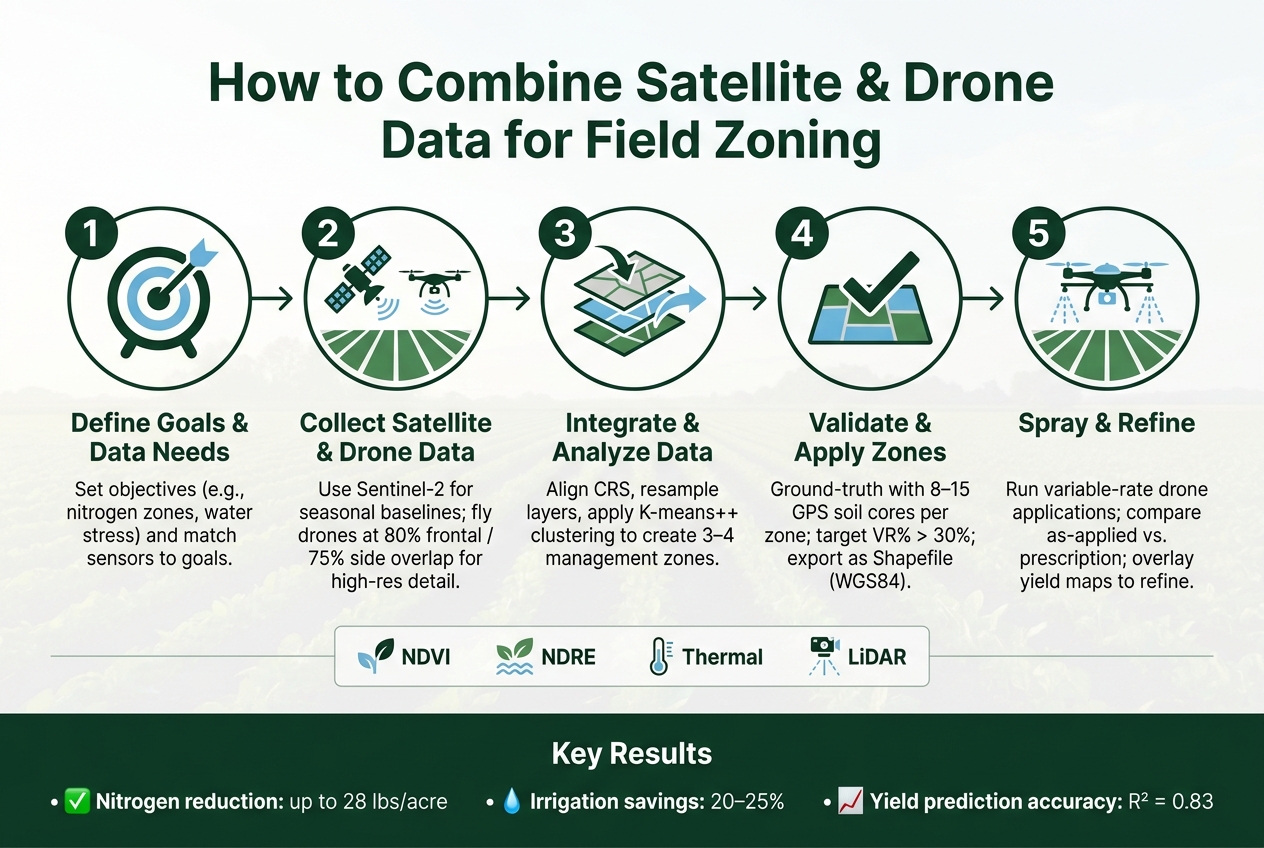
How to Combine Satellite & Drone Data for Field Zoning (5-Step Workflow)
Step 1: Define Your Zoning Goals and Data Requirements
Set Clear Zoning Objectives
Before diving into data collection, it's crucial to clarify the problem you're trying to solve. Without clear objectives, you risk wasting valuable flight time and collecting data that won’t help you make decisions. Typical goals include tasks like variable-rate nitrogen application, irrigation scheduling, early detection of diseases or pests, weed spot-spraying, or identifying areas that need replanting due to poor emergence or stand gaps.
Your specific goals will dictate the sensors you need, how often you should fly, and how to structure your zones. For instance, if you’re concerned about water stress, thermal imagery can reveal issues 5–7 days earlier than traditional visual scouting methods [9]. Start by defining one or two primary objectives before moving forward.
Once you’ve pinpointed your goals, identify the data types required to ensure your chosen sensors align with your needs.
Know Which Data Types You Need
With clear objectives in mind, focus on selecting the right data sources. Satellite imagery is a great starting point, especially Sentinel-2, which has been providing free data since 2015. It’s an effective way to analyze long-term productivity trends across large areas. For more detailed, in-season insights, drones can deliver centimeter-level resolution that satellites simply can’t match.
Choosing the right sensor is just as important as choosing the right platform. NDVI (Normalized Difference Vegetation Index) is perfect for gauging early-season vigor and overall biomass. However, it becomes less effective once the crop canopy closes (typically around the V10-VT stage in corn). At that point, NDRE (Normalized Difference Red Edge) is more reliable, capturing up to 88% of nitrogen variability in dense-canopy crops [9]. If water stress is your concern, a thermal camera is the way to go. And in areas with uneven terrain, tools like LiDAR or RTK elevation data can help distinguish between waterlogged low spots and drought-prone hilltops, which might look identical on a standard NDVI map [8].
| Diagnostic Goal | Recommended Sensor | Typical Flight Altitude |
|---|---|---|
| Nitrogen deficiency zones | Multispectral (NDRE) | ~400 ft (120 m) |
| Early disease detection | Multispectral / RGB | ~200 ft (60 m) |
| Water stress mapping | Thermal | ~200–400 ft |
| General vigor / biomass | NDVI | ~500 ft (150 m) |
"A red spot on an NDVI map isn't always a cry for nitrogen; it could be a sign of water stress, pest pressure, or simply a natural part of the crop's late-season senescence." - Marcus Thorne, Precision Agriculture Specialist [9]
After identifying the right sensors, the next step is to select tools and data providers that simplify processing and mapping.
Choose the Right Tools and Providers
For satellite data, Sentinel-2 remains the top free resource for building multi-year productivity baselines. When it comes to processing and creating prescription maps, platforms like PIX4Dfields and Sentera FieldAgent are excellent choices. Both allow you to integrate satellite and drone imagery into a single workspace, with PIX4Dfields offering fully offline processing - a handy feature for areas with limited internet access [7]. These tools help you combine satellite and drone data seamlessly, turning it into actionable zoning maps for precise applications.
When selecting drone hardware, think about your acreage and specific needs. Fixed-wing drones are ideal for covering large fields (500+ acres), while quadcopters are better suited for targeted, low-altitude inspections in problem areas. If you require mapping payloads or RTK accessories for precise georeferencing, Drone Spray Pro offers RTK dongles and supports various agricultural drone setups. Their selection includes DJI Agras models, making it easy to find a configuration that suits your operation right from the start.
sbb-itb-3b7eef7
Step 2: Collect and Prepare Satellite and Drone Data
Prepare Your Satellite Imagery
Once you've defined your goals and chosen the right sensors, it's time to gather your satellite data. This step is crucial for creating accurate field zones. Start by accessing satellite imagery from sources like Sentinel-2 via Google Earth Engine or platforms like EOSDA. These platforms offer free access to multi-year crop health data. Be sure to filter your scenes for less than 10% cloud cover - clouds, even thin ones, can distort vegetation index readings.
After securing clear imagery, align your vegetation index with your crop's growth stage. For early-season analysis, MSAVI is ideal because it minimizes soil reflectance, which can throw off standard NDVI readings. As the crop canopy develops, switch to NDRE for better results [11]. If you're building a multi-year productivity baseline, use NDVI across three to five growing seasons to identify consistently strong and weak zones. This groundwork ensures you're well-prepared before deploying drones.
Plan and Execute Drone Missions
Drones fill in the gaps where satellite imagery falls short, delivering finer details for field zoning and prescription mapping. To get the best results, set your drone's frontal overlap to 80% and side overlap to 75% [12]. Schedule flights within two hours of solar noon to minimize shadows, and adjust the altitude based on your crop type to maintain optimal image resolution. Be mindful of moving cloud shadows, as they can create false stress signals in multispectral data [12].
For precise positioning, RTK (Real-Time Kinematic) is the gold standard. Allow 3–5 minutes for RTK initialization before takeoff. If you're operating in areas where radio signals may drop - like near tree lines or buildings - consider using PPK (Post-Processed Kinematic). PPK logs correction data during the flight and fills in any gaps afterward [13]. If you're looking for hardware options, Drone Spray Pro offers RTK dongles and supports agricultural drones like DJI Agras, designed for precision mapping.
"For most row crop scouting applications, 35–40 meters AGL delivers the optimal balance between ground sample distance and mission efficiency." - Expert Insight, DJI Mavic 3 Multispectral Guide [12]
Process Drone Imagery into Usable Files
Once your drone flights are complete, the next step is processing the images into usable files. This involves stitching raw images into an orthomosaic - a georeferenced map that aligns seamlessly with your satellite data. Software like PIX4Dfields is well-suited for this task.
"I was just amazed at the speed of the processing. I can work offline, so I can take pictures with the drone and process them on the spot." - Mr. Muikaichi, Northern Innovation [7]
Ensure that each image's EXIF data includes embedded geotags; without these, the software won't be able to correctly place your images on the map. Also, make sure your drone data and satellite layers use the same Coordinate Reference System (CRS), such as WGS84 or the appropriate UTM zone for your area. Mismatched CRS settings can lead to alignment errors when merging data [14] [15].
Export your final outputs in formats that work with GIS software and agricultural systems. Use GeoTIFF for raster layers like orthomosaics and index maps, and Shapefile or ISOXML for prescription zones. This ensures compatibility with spray drones and other precision agriculture tools, creating a unified data set for effective field zone management.
Step 3: Integrate and Analyze Data for Field Zoning
Align and Merge Data Layers
Once your satellite and drone data are ready, the next step is to combine them into a unified dataset. To do this, you'll need to resample the drone data (with centimeter-level resolution) and Sentinel-2 imagery (around 10 meters per pixel) to a common resolution. Using a moving window ensures the pixels align accurately [4][17].
Make sure all layers share the same Coordinate Reference System (CRS) and have undergone radiometric calibration [4][16]. Tools like QGIS (with the "Precision Zones" plugin) or Python libraries such as GDAL and Rasterio can simplify tasks like clipping, reprojecting, and stacking your layers. If you're working with multiple data types - like multispectral, thermal, and soil data - Principal Component Analysis (PCA) can help reduce the dataset's complexity. This makes clustering faster and more precise, ultimately leading to better-defined variable-rate application zones [17].
"The combination of drone-supplied imagery and satellite-supplied imagery will yield the most comprehensive large-scale mapping capability." - GeoWGS84 Corp [16]
With your data layers successfully integrated, you’re ready to divide the field into distinct management zones.
Build Management Zones
Once the data layers are merged, the next step is to create management zones. K-means++ clustering is a reliable method for this [1][17]. To determine the optimal number of zones, use techniques like the Elbow Method or Silhouette Index. In most cases, 3 to 4 zones strike a good balance between detail and practicality [1][17].
After clustering, use a modal filter (approximately 20-foot radius) to remove isolated pixels, resulting in smooth and continuous zones. Validate your results by calculating the Variance Reduction (VR%) metric. A higher VR% indicates that the zones effectively group similar areas, reflecting the field's variability and enhancing the precision of variable-rate prescriptions [17].
Researchers at the University of Campinas (UNICAMP) demonstrated this approach on a 107-acre grain farm in Cosmópolis, Brazil. By integrating Sentinel-2 EVI, Sentinel-1 SAR, and drone-derived soil data - and applying PCA with K-means++ clustering validated by VR% - they significantly reduced variability within zones for phosphorus, potassium, and Cation Exchange Capacity (CEC) [17].
Compare Data Fusion Methods
Before finalizing your zoning, evaluate which data fusion method best suits your integrated dataset. The three main options - pixel-based, feature-based, and decision-based - each have distinct applications:
| Fusion Method | Description | Best Use Case |
|---|---|---|
| Pixel-based | Combines raw pixel values from both sensors | High-resolution nutrient and biomass mapping [4] |
| Feature-based | Segments images into objects before merging | Delineating field boundaries or identifying crop patches [18] |
| Decision-based | Merges outputs from separate analyses | Finalizing variable-rate maps using yield, soil, and health data [4] |
For many U.S. row crop operations - like those growing corn, soybeans, and wheat - pixel-based fusion works well for generating detailed nutrient maps for variable-rate applications. Decision-based fusion becomes particularly useful when incorporating additional datasets like yield maps or soil EC surveys to refine prescription zones [4].
It's worth noting that ultra-high resolution imagery (e.g., 1-inch Ground Sample Distance, or GSD) can sometimes introduce noise. A GSD of approximately 4 inches (0.10 m) tends to produce cleaner crop maps and more reliable zoning results [19].
"k-means is the optimal clustering method for MZ delineation, and the input data should be normalized." - S. Hamed Javadi, Researcher, IMEC [2]
Step 4: Validate and Apply Field Zones
Ground-Truth Your Zones in the Field
Once you've created field zones, the next step is to validate them by comparing them to actual field conditions. This means physically walking through the field to spot details that remote data might miss, like soil color changes, drainage patterns, compaction, or erosion. To ensure accurate results, collect 8–15 GPS-guided soil cores per zone at a consistent depth (either 0–8 inches or 0–12 inches for deeper profiles) [21].
To check how well your zones are defined, use the Variance Reduction (VR%) metric from Step 3. This metric evaluates how effectively zones group similar areas. A VR% above 30% is ideal, indicating strong grouping of similar conditions. Scores below 10% suggest that the zones need adjustment [17].
| VR% Value | Performance Class | What It Means |
|---|---|---|
| < 10% | Poor | Zones don't reduce field variability |
| 10–20% | Moderate | Some benefit, but limited grouping |
| 20–30% | Good | Zones capture major field variation |
| > 30% | Excellent | Strong internal homogeneity per zone |
Aim for a VR% above 30% for the most effective zoning. You can also use split-sample testing to validate your zones. Hold back a portion of your sampling points during the clustering process, then test whether the final zones accurately predict the nutrient levels of those withheld points [21]. If the zones perform well, you can proceed with confidence.
"Precision farming is a whole workflow: measure, georeference, analyze, prescribe, act, and verify." - Kevin Grub, Author [20]
Once the zones are validated, the next step is to turn them into actionable maps for your equipment.
Export and Load Zoning Maps into Equipment
After validating your zones, convert them into a format compatible with your equipment. The most commonly used format is Shapefiles (.shp), which work with most spray drone controllers, tractor terminals, and farm management software. Make sure the coordinates are set to WGS84 (EPSG:4326) for accurate GPS alignment in the field [22][23].
When exporting, ensure the shapefile's attribute table includes these four key columns:
-
rate(decimal value) -
rateInt(integer value) -
unit(e.g., oz/ac or fl oz/ac) -
zone(ID number) [23]
It's also critical to match the software and drone controller units to avoid any application errors.
For drones like the DJI Agras, store the prescription file in a DJI > ShapeFile folder structure on the SD card so the controller recognizes it automatically. If you're using an XAG system, keep in mind it supports up to 3 management zones and requires a minimum tile size of 5×5 meters for compatibility.
Run Spray Drone Operations by Zone
Once your prescription is loaded, the drone can automatically apply variable rates across zones in a single flight. To ensure consistent coverage, maintain a flight height of 5–10 feet (1.5–3 meters) and a spraying width of about 16 feet (5 meters).
When setting up the drone controller, you’ll need to choose a resampling method for zone boundaries. Use "Max Value" resampling to apply the higher rate when crossing between zones, or opt for "Average Value" if a smoother transition is better suited for your crop or input type. For larger fields - those over 80 acres (33 hectares) - split the mission into smaller flight blocks to stay within controller limits and conserve battery life.
Drones like the DJI Agras and Talos T60X from Drone Spray Pro are designed for zone-based prescription flying. After completing your operation, retrieve the as-applied map from the controller and compare it to your prescription. At harvest, overlay the yield map with your zones to evaluate whether the variable-rate approach worked as intended. Use this data to refine your zones for the next growing season [20].
Step 5: Handle Common Challenges and Follow Best Practices
Fix Spatial and Timing Mismatches
When merging satellite and drone data, one frequent challenge is aligning the datasets both spatially and temporally. Crops can change rapidly, and even a few days' difference between a satellite pass and a drone flight can lead to noticeably different NDVI readings.
To address spatial drift, use Ground Control Points (GCPs) - these are physical markers placed in the field that help anchor drone imagery to the satellite base map. Before merging data, ensure both datasets are using the same Coordinate Reference System (CRS). For timing, aim to schedule drone flights as close as possible to the satellite's overpass date. For instance, Sentinel-2 revisits the same area every five days, providing a clear window for data collection [4][6].
Drone imagery is also helpful for filling gaps caused by cloud cover in satellite data. Keeping detailed flight logs - documenting the date, time, sensor type, and weather conditions for each mission - makes syncing datasets much easier later on [16]. Fixing these mismatches ensures your integrated data reflects actual field conditions accurately.
Correct Radiometric and Sensor Differences
Once spatial and temporal issues are resolved, the next step is harmonizing the outputs from different sensors. multispectral drone packages typically capture data in the 400–1,000 nm spectral range, while satellites like Sentinel-2 cover a much broader range, from 396–2,122 nm [4]. Without proper calibration, the raw spectral values will differ significantly.
To address this, deploy a calibrated reflectance panel before each drone flight to convert raw sensor readings into true surface reflectance values. On the satellite side, always work with Level-2A (Bottom of Atmosphere) products instead of raw Top of Atmosphere data. These Level-2A products remove atmospheric interference, making them easier to compare with drone data [5]. When merging datasets, resample drone pixels to match the satellite’s resolution - such as 10 meters for Sentinel-2 - using bilinear interpolation to preserve data quality [10].
"Radiometric calibration ensures that sensor responses are normalized for atmospheric effects and variations in illumination, allowing accurate comparisons of spectral data across time and platforms." - Frontiers in Remote Sensing [4]
Manage Data Accuracy and File Size
After harmonizing sensor data, focus on maintaining accuracy while managing file sizes effectively. High-resolution drone imagery can quickly balloon in size, making storage and processing a challenge.
For precise geolocation, use RTK-enabled drones, which provide horizontal accuracy within 3–5 cm, ensuring that drone imagery aligns seamlessly with satellite layers [24]. Tools like Drone Spray Pro offer RTK-compatible accessories, including dongles, to enhance precision in the field. To manage large raster files, opt for Cloud Optimized GeoTIFFs (COGs). These allow software to access only the necessary parts of a file, significantly reducing processing time. Cloud services like Amazon S3 or Google Cloud can further streamline storage by keeping your data accessible without overwhelming local systems.
If reducing data volume is a priority, consider using a Spatial Sampling Optimization (SSO) approach. This method involves selecting only the minimum number of drone points needed to calibrate satellite data, which can cut flight distances by 7,000 to 8,000 meters and improve sampling efficiency by 38.7% [5]. Keeping your data streamlined and well-organized supports faster and more reliable field zoning operations.
How to be a Drone Mapping Pro | Deep Dive
Conclusion: Getting Precise Results with Satellite and Drone Data
Blending satellite and drone data isn't just about leveraging technology - it's about making informed, efficient decisions for every acre of land under your care. Satellites offer a broad perspective and historical insights, while drones dive into the finer details, filling in gaps like those caused by cloud cover. Together, these tools deliver highly accurate and actionable field zones.
The results speak for themselves. Integrated UAV-satellite systems have shown the potential to cut irrigation costs by 20–25% and reduce nitrogen application by up to 31 kg/ha (around 13 kg per acre), all while maintaining productivity[3]. Crop yield predictions using combined data boast an R² of 0.83, a clear improvement over satellite-only models[3]. These advancements directly contribute to lower input costs and more reliable harvests, making the case for integrating these platforms into your field management strategy.
"The integration of satellite-improved imagery with UAS data holds significant promise for both researchers and plant breeders, revolutionizing agricultural practices." - Frontiers in Remote Sensing[4]
For example, RTK-enabled spray drones like the DJI Agras and XAG systems, available through Drone Spray Pro, are designed to deliver variable-rate applications with the precision required for zone-based management. When paired with RTK dongles and multispectral sensors, these drones can seamlessly integrate with other data sources to enhance your workflow.
FAQs
How do I pick the right satellite and drone data for my crop goal?
Start by identifying your specific agricultural objective - whether it’s monitoring crop health, tracking land-use changes, or something else entirely. This clarity will guide your technology choices.
For large-scale coverage and consistent updates, satellite data is a great option. If you need detailed, high-resolution imagery for specific areas, drone imagery is the way to go.
Selecting the right sensors is equally important:
- Multispectral sensors: Ideal for analyzing vegetation health.
- Thermal sensors: Useful for detecting water stress in crops.
- LiDAR sensors: Perfect for capturing elevation and terrain details.
If you’re in Idaho and need expert advice, Drone Spray Pro specializes in customized drone solutions for farming needs.
What’s the best way to align satellite and drone maps so zones match?
To bring satellite and drone maps into alignment, start by preprocessing both datasets into a shared reference system. Incorporate Ground Control Points (GCPs) to georeference the drone imagery, ensuring its coordinates align with the satellite map. Verify that both datasets are using the same coordinate system, such as WGS84 or UTM, and adjust them to cover the same spatial extent. Once everything is aligned, overlay the drone data onto the satellite map for seamless field zoning.
How many management zones should I create for variable-rate work?
Research indicates that using 3 to 4 management zones is often the sweet spot for variable-rate applications. This range strikes a balance between capturing field variability, making the data easy to interpret, and keeping the application process manageable. While it's technically possible to create anywhere from 2 to 8 zones, sticking to 3 to 4 helps avoid overcomplicating things. Many advanced tools rely on techniques like Elbow analysis or Silhouette analysis to determine the ideal number of zones based on your field's unique data.